Curated OER
Solving Systems using Elimination
Using elimination to find the point of intersection of two lines, students learn to solve systems of equation. They graph their solutions and use the TI to verify the solution.
Curated OER
Linear Systems and Calories
Students define and graph properties of linear equations. In this algebra lesson, students write systems of equations to represent functions. They relate linear equations to the real world.
Curated OER
Watch Your P' and Q's
Pupils solve polynomial functions by graphing. They factor rational expressions to find the roots of the equation and apply the rational zero theorem to find the zeros of a polynomial.
Curated OER
Analyzing Birds and Planes
Students find a variety of topics and subjects in this lesson. In the math section of this lesson, students graph linear equations and analyze their data. They solve one and two step equations to find the variable.
Curated OER
Nutrients by the Numbers
Students read and discuss an article on the amount of sugar in various food products. They compare the nutritional values of food products, calculate their daily intake of nutrients, analyze serving sizes, and compare/contrast their own...
Curated OER
The North (Wall) Star
Students engage in a lesson which shows them that celestial navigation is the art and science of finding one's geographic position by means of astronomical observations, particularly by measuring altitudes of celestial objects - sun,...
Curated OER
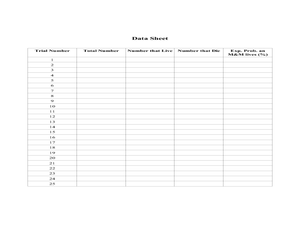
RIP M&M's
Learners solve theoretical probability problems. In this algebra lesson, students apply the concept of probabilities to solving real life scenarios. They collect data and graph it using experimental probability.
Curated OER
Introduction to Conic Sections
Learners slice cones and identify the different conics formed. They then derive the formula to solve problems involving cones. Pull out the TI calculators to visualize the slicing and the different parts and properties created.
Curated OER
Changing Twines: Exploring Area and Perimeter
Third graders review formulas for area and perimeter in quadrilaterals. They arrange pre-cut twine on a centimeter graph paper to create non-congruent quadrilaterals. They calculate the perimeter and area of each form.
Curated OER
Lines of Fit
Learners graph an equation and analyze the data. In this algebra lesson plan, students graph scatter plots and identify the line of best fit using positive correlation, negative correlation an d no correlation. They apply their data...
Curated OER
A Picture's Worth a Thousand Words
Students analyze the numbers of male vs female administrators and teachers from their school. In this gender equality lesson plan, students use school yearbooks from the 1950's threw present to count how many male vs. female teachers,...
Curated OER
The Disappearing Honeybees: Tracking Honeybee Decline
Students practice graphing and other math skills to track number of honeybee colonies present in United States since 1978, discuss major crops that are dependent on insect pollinators, and examine reasons for decline of United States...
Curated OER
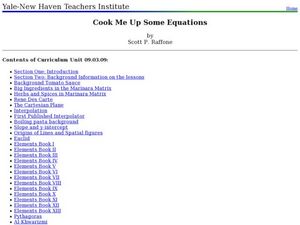
Cook Me Up Some Equations
Students study a variety of math concepts in the context of cooking up a meal. In this math lesson plan, students calculate surface area and volume. They draw and interpret different types of graphs.
Curated OER
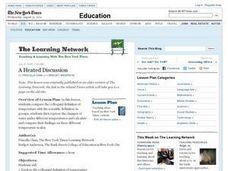
A Heated Discussion
Young scholars compare the colloquial definition of temperature with the scientific definition. They, in groups, then explore the changes of water under different temperatures and calculate and compare their findings on three different...
Curated OER
How Fast Is Your Car?
Eighth graders discover the relationship between speed, distance, and time. They calculate speed and represent their data graphically. They, in groups, design a ramp for their matchbox car. The goal is to see who's ramp produces the...
Curated OER
The Air Up There
For this data collection and analysis lesson, students observe and graph the weather conditions during one school week, then calculate the average weather temperature. Extensions are included.
Curated OER
Celsius to Fahrenheit
Students convert degrees between two different units. In this algebra lesson, students graph linear equations and identify the line of best fit. They use their line of best fit to make predictions given a set of data.
Curated OER
On the Road Again
Students work with patterns to develop formulas that will help them determine total cost. In this patterning lesson, students watch a video about an NBA trainer. (not included) They work in groups to access the assigned Internet websites...
Curated OER
Rectilinear Motion
Twelfth graders rewrite word problems using algebraic expressions. In this calculus lesson, 12th graders calculate the velocity, time and acceleration while analyzing real life scenarios. They solve problems related to when the...
Curated OER
Populations and Life Cycles
Students explore biology by researching ocean statistics. In this data analysis lesson, students conduct a snail examination experiment utilizing live pouch snails. Students collect data about the snails over the course of six weeks and...
Curated OER
A Wet Welcome Home
Students investigate data collection and analysis. In this Algebra I lesson, students create a scatter plot and find the equation of best fit in a simulation of a leaking water pipe.
Curated OER
Lessons for Atlatl Users with Some Experience-Grade 5
Fifth graders throw darts, collecting data for distance traveled. In this data analysis lesson, 5th graders throw a dart using an atlatl. They calculate the speed for each throw and determine the best dart length for distance throws.
Curated OER
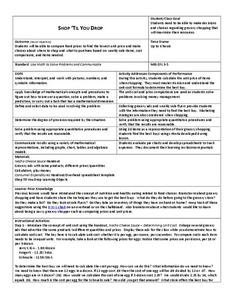
Shop 'Til You Drop
Students evaluate food prices. In this real world math lesson plan, students compare the cost of various grocery items to determine which is the best deal. They work in groups using grocery ads to decide how to get the most product for...
Curated OER
ACC Basketball Statistics
Students use math skills and create a spreadsheet. In this statistics and computer skills lesson, students gather ACC basketball statistics, convert fractions to decimals and then percents. Students use the gathered information to create...


