Curated OER
Domian and Range of Graphs
High schoolers determine the domain and range of various graphs using a graphing calculator. Given a set of graphs to analyze, learners calculate the range and domain of the graphs by plotting the graphs on their calculators. Downloads...
Inside Mathematics
Squares and Circles
It's all about lines when going around. Pupils graph the relationship between the length of a side of a square and its perimeter. Class members explain the origin in context of the side length and perimeter. They compare the graph to the...
Curated OER
Review Graphing Parabolas & Circles
Students review how to graph parabolas. They practice graphing two different parabolas using the vertex and table method. They solve problems related to graphing circles, determining the radius and the center.
Wordpress
Introduction to Exponential Functions
This lesson plan begins with a review of linear functions and segues nicely over its fifteen examples and problems into a deep study of exponential functions. Linear and exponential growth are compared in an investment task. Data tables...
EngageNY
The Graph of the Natural Logarithm Function
If two is company and three's a crowd, then what's e? Scholars observe how changes in the base affect the graph of a logarithmic function. They then graph the natural logarithm function and learn that all logarithmic functions can be...
Curated OER
Math: Navigating the World Around Me
Young mathematicians research and discuss real world math word problems and ways in which they apply math concepts in their everyday lives. They create a storyboard of a math word problem from which they create a slide for a multi-media...
Baylor College
Global Atmospheric Change: The Math Link
Change up the classroom atmosphere with this interdisciplinary resource. Following along with the children's book Mr. Slaptail's Curious Contraption, these math worksheets provide practice with a wide range of topics including...
Willow Tree
Line Graphs
Some data just doesn't follow a straight path. Learners use line graphs to represent data that changes over time. They use the graphs to analyze the data and make conclusions.
CCSS Math Activities
Smarter Balanced Sample Items: 8th Grade Math – Claim 2
Math can be a problem in eighth grade. Sample items show how problem solving exists within the eighth grade standards. Part of the Gr. 8 Claim 2 - 4 Item Slide Shows series, the presentation contains eight items to illustrate the...
Utah Education Network (UEN)
Finding Slope of a Line from Graphs, Tables, and Ordered Pairs
Middle schoolers explore the concept of slope in numerous ways and start to look at simple linear equations. They describe the slope in a variety of ways such as the steepness of a line, developing a ratio, using graphs, using similar...
Curated OER
Intersecting Graphs
Ninth graders know how to solve a system of linear equations, but what happens when the system involves an exponential function? The instructional slideshow teaches viewers to determine solutions to systems of equations with linear...
BW Walch
Solving Systems of Linear Equations
Solving systems of equations underpins much of advanced algebra, especially linear algebra. Developing an intuition for the kinds and descriptions of solutions is key for success in those later courses. This intuition is exactly what...
Concord Consortium
Crossing the Axis
Mathematicians typically reference eight different types of functions. Scholars learn about the requirements for graphing a function and must decide how many different functions fit. To finish, they define each specific function meeting...
Texas Instraments
Getting Started Dilemma
Get out those thinking caps and apply graphing functions to a real-world problem. Use the TI-83 graphing calculator to evaluate algebraic expressions that are imbedded in a series of real-world scenarios. A great lesson!
Math Worksheets Land
Pie or Circle Graphs—Step-by-Step Lesson
How do you display data that you've collected in a pie chart? Follow a clear step-by-step guide to turning survey results into a visible format. It shows kids how to determine the percentage of the whole that each section represents.
Georgia Department of Education
Math Class
Young analysts use real (provided) data from a class's test scores to practice using statistical tools. Not only do learners calculate measures of center and spread (including mean, median, deviation, and IQ range), but...
Curated OER
Performance-Based Assessment Practice Test (Grade 6 Math)
Keep track of your sixth graders' mastery of the Common Core math standards with this practice assessment. Taking a different approach than most standardized tests, this resource includes not only multiple choice questions, but also...
Curated OER
Matchstick Math: Using Manipulatives to Model Linear, Quadratic, and Exponential Functions
Playing with matches (unlit, of course) becomes an engaging learning experience in this fun instructional unit. Teach pupils how to apply properties of exponential functions to solve problems. They differentiate between quadratic and...
CCSS Math Activities
Smarter Balanced Sample Items: 8th Grade Math – Claim 4
A math model is a good model. A slide show presents 10 sample items on modeling and data analysis. Items from Smarter Balanced illustrate different ways that Claim 4 may be assessed on the 8th grade math assessment. The presentation is...
Radford University
Calculating the Cost: Algebraic Planning for a First Car
Scholars decide which job to take based on the pay. They then research cars to potentially purchase and determine the total cost of the car. Finally, they calculate how long they would have to work to purchase the car along with how much...
CK-12 Foundation
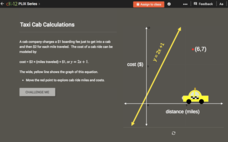
Checking Solutions to Equations: Taxi Cab Calculations
Ride to success in checking solutions to equations. Scholars use an interactive graph to identify points that are solutions to a linear equation. Interpreting these points in terms of the context completes the activity.
CCSS Math Activities
Smarter Balanced Sample Items: High School Math – Target L
Functions are for forming context models. A PowerPoint file contains 11 questions for learners to answer. It covers the high school SBAC Claim 1 Target L item specifications and requires interpreting functions, determining appropriate...
Curated OER
Basic Algebra and Computers: Spreadsheets, Charts, and Simple Line Graphs
Students, while in the computer lab, assess how to use Microsoft Excel as a "graphing calculator." They view visual representations of line graphs in a Cartesian plane while incorporating basic skills for using Excel productively.
Curated OER
What's My Pattern?
Students recognize, describe and extend patterns in three activities. They organize data, find patterns and describe the rule for the pattern as well as use the graphing calculator to graph the data to make and test predictions. In the...


