Math Worksheets Land
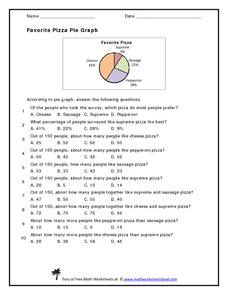
Favorite Pizza Pie Graph
You've heard of a pie graph, but what about a pizza pie graph? Challenge young mathematicians to answer ten questions based on a random survey of people's favorite pizzas. A pie graph displays the percentages of each type of pizza. Some...
Mathematics Assessment Project
Middle School Mathematics Test 1
A 13-page test contains two 40-minute sections, which provide word problems and applied analysis to cover material from pre-algebra through geometry.
Mathematics Assessment Project
Middle School Mathematics Test 5
A middle school test contains two 40-minute sections covering material through algebra. All questions involve applied problem solving or mathematical analysis.
Mathed Up!
Frequency Polygons
Frequency polygons are a different way to represent frequencies over intervals. Pupils take frequencies for intervals of data from a frequency table and plot them as a frequency polygon. Budding mathematicians find information about the...
Mathed Up!
Pie Charts
Representing data is as easy as pie. Class members construct pie charts given a frequency table. Individuals then determine the size of the angles needed for each sector and interpret the size of sectors within the context of frequency....
Rice University
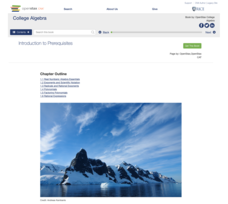
College Algebra
Is there more to college algebra than this? Even though the eBook is designed for a college algebra course, there are several topics that align to Algebra II or Pre-calculus courses. Topics begin with linear equation and inequalities,...
Curated OER
Raisin the Statistical Roof
Use a box of raisins to help introduce the concept of data analysis. Learners collect, analyze and display their data using a variety of methods. The included worksheet takes them through a step-by-step analysis process and graphing.
Curated OER
Converting Fractions to Decimals
Seventh graders take a simple fraction and give it decimal form either by the use of equivalent fractions or division with a calculator.
Curated OER
Does Sunlight Effect Leaf Size?
Students make estimates and then measure leaves for accuracy. They calculate the area of the leaves by drawing an outline on graph paper and counting the squares. They compare the leaves exposed to sunlight to those that are in constant...
Curated OER
Slippery Slope
Middle schoolers use a computer to complete activitites about slope. They find the slope of mountains, roofs, and stairs using rise over run. Pupils are shown different types of slopes and have to identify if the slope is positive,...
Curated OER
Linear Inequalities in One and Two Variables: Rays and Half Planes
Define rays and half planes, including the concepts of boundary lines and prerequisite knowledge of coordinate planes. Given linear inequalities in one and two variables, your class will compare the differences. They will also graph...
Curated OER
Off to College
High schoolers investigate linear, quadratic and exponential equations using the TI calculator. They identify relation and functions using ordered pairs, graph the data, analyze the data, and relate it to real-world situations.
Curated OER
Turn Up the Volume
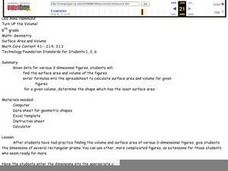
Measuring volume can be a mystery for 5th graders, but this hands-on activity gives the gift of discovery. The volume of simple rectangular solids and irregular shapes are calculated through various methods including displacing liquid in...
Curated OER
Capture/Recapture
Students use proportions to estimate the size of populations. They describe the data with using a graph or table of the estimate. Students use descriptive statistics to calculate mean, median, and mode. They also compare and contrast an...
Curated OER
Ohm's Law
In this Ohm's Law worksheet, students answer 8 questions which include multiple choice, graphs, and short answer. They write the definitions of voltage, potential difference, current, and resistance. They complete a graph about volts,...
Curated OER
Translate Word Phrases and Sentences into Equations
Use this video to show your learners an example of how to translate word phrases into an equation to solve a real-world problem. The presenter begins with a review of how to use cross products to solve a proportion, including how to do...
Curated OER
Data Analysis of Ground Level Ozone
Sixth graders construct and interpret graphs from ozone data collected in Phoenix area. Can be adapted to other areas.
Curated OER
The Race of Baseball All-Stars
Collect and analyze data. Pupils graph their data and model with it to solve real life problems. They use logic and deductive reasoning to draw conclusions.
Curated OER
How Deep Do They Dive
Students calculate and graph the diving depths of various types of whales. They cut out and glue whale pictures on a worksheet to represent the diving depths for five whales, and discuss how people use graphs to communicate.
Curated OER
And You Thought Gasoline Was Expensive!
Students carry out a cost analysis. In this comparative math lesson, students compare the cost of equal measures of gasoline to mouthwash, house paint, fruit juice, white-out, and other liquids.
Curated OER
Stick-Slip Movement
Ninth graders operate a model to observe the type of motion that occurs at a fault during an earthquake. They explore the effects of several variables. Students measure movement, calculate averages and plot and graph information.
Curated OER
Investigation- What Does It Cost?
Eighth graders investigate percents by comparing different discounts on the same sale item, practice graphing percents, and look at reasonable and unreasonable "percents off" a sale item.
Curated OER
Buying a Car
Eighth graders create spreadsheets to calculate payments. They create a list of items they would like to purchase that require monthly payments. They simulate buying a car and create a spreadsheet to determine the amount of the monthly...
Curated OER
Is the Rainbow Fair?
Third graders perform statistical calculations. Given a bag of Skittles, 3rd graders sort and collect data regarding the colors included in their bag. Using spreadsheet software, students create a bar graph of the information collected....


