Curated OER
Review Graphing Parabolas & Circles
Students review how to graph parabolas. They practice graphing two different parabolas using the vertex and table method. They solve problems related to graphing circles, determining the radius and the center.
Curated OER
Exploring Quadratic Data : Transformation Graphing
High schoolers analyze the vertex form of a parabola and find an approximate fit of a model. They explain the quadratic parabola function and its properties by developing quadratic models. They use translation and dilation to change the...
Curated OER
Writing Equations of Parabolas in Vertex Form
Pupils use their knowledge of the vertex form of a quadratic equation to graph parabolas using a graphing calculator, given a specific move to make. this lesson may be used as a review or as extra practice, in groups or individually.
Curated OER
Parabolas
Students investigate parabolas and their equations. In this parabolas and their equations lesson, students graph quadratic equations on their graphing calculator. Students find the axis of symmetry of a parabola. ...
EngageNY
Graphs of Quadratic Functions
How high is too high for a belly flop? Learners analyze data to model the world record belly flop using a quadratic equation. They create a graph and analyze the key features and apply them to the context of the video.
Curated OER
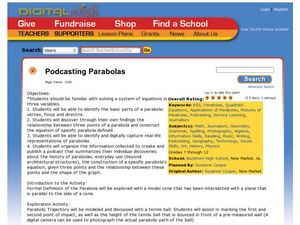
Podcasting Parabolas
Students explore parabolas. In this algebra and technology instructional activity, students construct the equation of a specific parabola, then take digital photos of real-life representations of these parabolas. Students...
Curated OER
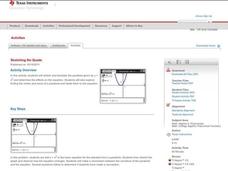
Stretching the Quads
Scholars investigate transforming parabolas. In this transforming parabolas lesson, they take the parent graph y=x^2 and transform it by shifting left, right, up, and down and shrinking and stretching. The class finds maximums,...
Curated OER
Quadratic Equations with the CBL 2
Learners practice generating parabolas with a motion sensor while determining the vertex form of the equation. They compare it to the regression equation from the calculator onto a data mate software. Each student completes several...
Curated OER
The "U's" Have IT!
Students explore the maximum and minimum values of parabola. In this exponential equations lesson, students use graphing calculators or TI Interactive Software to calculate values of parabola and graph x-intercepts of parabola.
Curated OER
Exploring Quadratic Data with Transformation Graphing
Using a data collection device to collect data regarding a bouncing ball, students use various features on graphing calculators to experiment with the parameters of the vertex form of the parabola and their effect on the shape of the...
Curated OER
Graphing Quadratic Functions
Pupils explore quadratic functions in this algebra lesson. They investigate transformation of quadratic functions using the TI calculator. They use the vertex form for this lesson.
Curated OER
Properties of Parabolas
Learn to identify the properties of parabolas. Students define parabola as the locus of all points equidistant from a fixed point and a fixed line. Also, interpret the equation for a parabola in vertex form and gain a visual...
Curated OER
Properties of Parabolas
Have your learners investigate parabolas. For this Algebra II lesson, high schoolers explore the basic definition of a parabola by using Cabri Jr. to create a parabola given the focus and directrix. Students interpret the equation...
Curated OER
Bouncing Ball : Function Families
A bouncing ball serves as more than entertainment when learning to apply quadratic functions to real-world events. This is the second of a two-part lesson, which can also be accessed from the website. The instructions say to measure the...
Virginia Department of Education
Transformational Graphing
Find relationships between the structure of a function and its graph. An engaging lesson explores seven parent functions and their graphs. Learners match functions to their graphs and describe transformations.
Curated OER
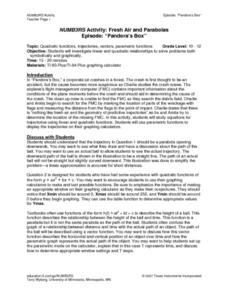
NUMB3RS Activity: Fresh Air and Parabolas
Explore parabolas and investigate linear and quadratic functions to solve problems symbolically and graphically. Also use parametric functions to display trajectories on a graphing calculator.
Curated OER
Using Symmetry to Find the Vertex of a Parabola
Learners engage in a lesson plan that is about finding the vertex of a parabola while using symmetry. They use the symmetry to find out where the two lines meet. The line is displayed with the help of a graphing calculator. The lesson...
Curated OER
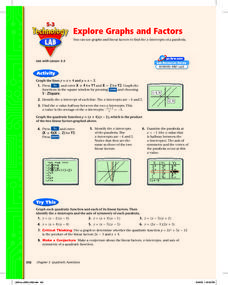
Explore Graphs and Factors
Pupils graph the factors of a quadratic as linear equations and graph the parabolic equation in factored form. Also, they investigate the relationship between the x-intercepts of the lines and the zeros of the parabola.
Curated OER
Parabolas
Students find equations of parabolas in real world scenarios. In this finding equations of parabolas in real world scenarios lesson, students find the equations of parabolas of US landmarks. Students put a grid on landmarks...
Curated OER
Don't Let Parabolas Throw You
Students identify relation, function, patterns and range. In this algebra lesson, students factor and graph quadratic equations. They use transformation to move the parabola around and make predictions.
Curated OER
Bouncing Ball
High schoolers collect height versus time data of a bouncing ball using the CBR 2™ data collection device. Using a quadratic equation they graph scatter plots, graph and interpret a quadratic function, apply the vertex form of a...
Curated OER
Sign of the Derivative
Learn how to investigate the change in a graph by dragging the cursor to observe the change in the function. They use the TI calculator to graph their parabola.
Curated OER
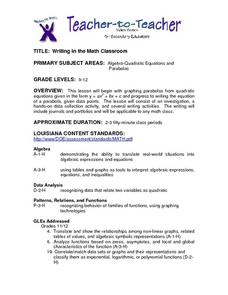
Writing in the Math Classroom
Students determine the vertex, y-intercept and direction of a parabola and write an explanation of how to graph a parabola. They collect and graph data using a calculator.
Curated OER
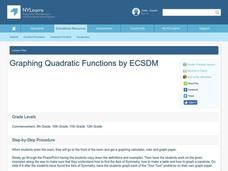
Graphing Quadratic Functions
Students graph quadratic functions. In this algebra lesson, students identify the vertex and intercepts of a quadratic equations and graph the parabola. They find the axis of symmetry and make a table to find the values of the parabola.


