Curated OER
Scatter Diagrams and Curve Fitting
In this Scatter Diagrams and Curve Fitting worksheet, students are guided in how to graph a scatter diagram (plot) and a Best Fit Line using a TI-83 graphing calculator.
Curated OER
Tilted Squares and Right Triangles
Students investigate squares. They generate patterns from structured situations and find a rule for the general term and express it using words and symbols. Students generate patterns from a rule and substitute values and formulas.
Curated OER
Finding and Estimating Square Roots
In this algebra worksheet, students solve the square root through estimation and through the calculator. They graph their solutions on a number line. There are 4 questions with an answer key.
Curated OER
Integrated Algebra Practice: Square Roots
For this square roots worksheet, students calculate the square roots of whole numbers and rational numbers. Seven problems have multiple choice answers. The remaining 13 problems are short answer. One problem involves graphing a...
EngageNY
Comparing Irrational Numbers
Build on your classes' understanding of irrational numbers by comparing their values. The 13th lesson in the 25-part module has individuals estimate values of both perfect and non-perfect roots. They finish by graphing these numbers on a...
Curated OER
Digger and the Gang
Help online friends Digger and Sprat from the BBC series to solve math problems! In a series of activities, your class will use data sets to calculate measurements, averages, means, and probabilities. The class completes worksheets and...
Teachers Network
A World of Symmetry: Math-Geometry
Define and identify the three basic forms of symmetry translation, rotation, and glides with your class. They cut out and arrange paper pattern blocks to illustrate symmetry, create a Cartesian graph, and design a rug with a symmetrical...
EngageNY
Analyzing Residuals (Part 1)
Just how far off is the least squares line? Using a graphing calculator, individuals or pairs create residual plots in order to determine how well a best fit line models data. Three examples walk through the calculator procedure of...
Virginia Department of Education
Radical Equations
Provide students with the skill for how to examine algebraic and graphical approaches to solving radical equations. Learners solve various radical equations involving square root and cube root expressions. They first solve using...
CK-12 Foundation
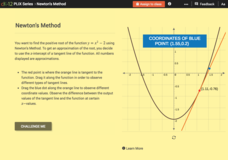
Newton's Method
Use an iterative process to find an approximation of a square root. Pupils use the interactive to find an approximation to find the positive root of a quadratic function with Newton's method. With the graphs, learners position the...
Shodor Education Foundation
InteGreat
Hands-on investigation of Riemann sums becomes possible without intensive arithmetic gymnastics with this interactive lesson plan. Learners manipulate online graphing tools to develop and test theories about right, left, and midpoint...
Curated OER
Representing Patterns & Evaluating Expressions
Write algebraic expressions, determine patterns, and evaluate expressions in a real-world context. Learners engage in a series of collaborative activities to identify, model, and give variables for real-world patterns. They write...
Curated OER
Geometric Shapes
In this geometry and shapes worksheet, 5th graders practice calculating the shaded area of 2 objects. Students count the squares on 2 grids to find the volume of each object in cube units.
Curated OER
Square Foot Garden
Students plant a garden and keep track of it. In this geometrical garden lesson plan, students collect data from their garden twice a week. They graph their finding and figure out how many square feet of growing space each person needs...
Curated OER
Graphing Square Root and Other Radical Functions
In this worksheet, students graph the square root and other radical functions by examining the parent function and the translations and shifts that occur within the function family. The two page worksheet contains twelve problems.
Virginia Department of Education
Line of Best Fit
Pupils work through a guided activity on fitting a linear equation to a set of data by entering the data into a calculator and trying to envision a line of best fit. They then have the calculator determine the least-squares line and...
Virginia Department of Education
Rational Functions: Intercepts, Asymptotes, and Discontinuity
Discover different patterns by making connections between a rational function and its graph. An engaging lesson asks scholars to explore the behavior of different rational functions. Groups discover a connection between the function and...
EngageNY
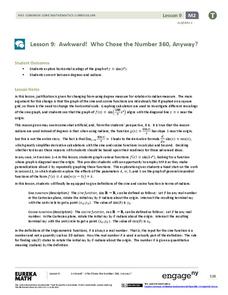
Awkward! Who Chose the Number 360, Anyway?
Don't give your classes the third degree. Use radians instead! While working with degrees, learners find that they are not efficient and explore radians as an alternative. They convert between the two measures and use radians with the...
Virginia Department of Education
Functions: Domain, Range, End Behavior, Increasing or Decreasing
Examine key features of various functions through exploration. A comprehensive lesson has learners describe the domain, range, end behavior and increasing/decreasing intervals of various functions. Function types include linear,...
EngageNY
Modeling with Quadratic Functions (part 1)
Relevance is key! The resource applies quadratic modeling by incorporating application of physics and business. Pupils work through scenarios of projectile motion and revenue/profit relationships. By using the key features of the graph,...
Curated OER
Rational Expressions Test with a Calculator
In this rational expression worksheet, students graph rational equations, evaluate limits, state intercepts, asymptotes, and roots and factor. This worksheet is designed as a test to be completed with a calculator.
Curated OER
The Truth About Triangles and Squares
Fourth graders investigate the patterns associated with both triangular and square numbers. They use counters as manipulatives to depict the numbers as needed but focus on problem solving using mental math techniques.
Inside Mathematics
Population
Population density, it is not all that it is plotted to be. Pupils analyze a scatter plot of population versus area for some of the states in the US. The class members respond to eight questions about the graph, specific points and...
Noyce Foundation
Pizza Crusts
Enough stuffed crust to go around. Pupils calculate the area and perimeter of a variety of pizza shapes, including rectangular and circular. Individuals design rectangular pizzas with a given area to maximize the amount of crust and do...


