Curated OER
Graphing the Four Forces
Using the Cartesian coordinate system, future flight experts plot points to determine whether or not an airplane will fly. With the four forces of weight, lift, drag, and thrust represented in different quadrants, your physics learners...
California Education Partners
Least and Greatest
Squares can be magic. Pupils use their knowledge of addition of positive and negative rational numbers to create a 3 X 3 magic square where the sums are 1. Scholars create addition and multiplication expressions with a set of rational...
EngageNY
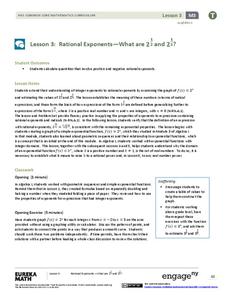
Rational Exponents—What are 2^1/2 and 2^1/3?
Are you rooting for your high schoolers to learn about rational exponents? In the third installment of a 35-part module, pupils first learn the meaning of 2^(1/n) by estimating values on the graph of y = 2^x and by using algebraic...
Corbett Maths
Inverse Proportion
Take an indirect view of proportionality. Using a similar approach of direct variation, the resource shows how to solve inverse proportions. The video steps through finding the constant of proportionality to write the formula for the...
EngageNY
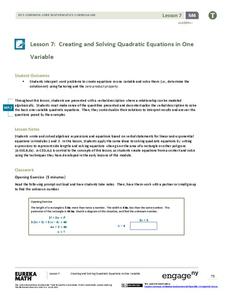
Creating and Solving Quadratic Equations in One Variable
Give your classes practice at modeling using quadratic models with a resource that uses area and integer problems to allow individuals to create second degree polynomials. Young mathematicians solve equations using factoring and then...
Shodor Education Foundation
Two Variable Function Pump
Use a function to operate on two variables. Pupils look at operating with complex numbers as a function of two variables. The interactive squares the input and adds a constant to it. Learners visualize the resulting output and its...
Curated OER
Graphing Data
Young scholars graph lines in a coordinate plane. For this geometry lesson, students graph lines on a coordinate plane, and identify the slope. They calculate the volume, area and perimeters of the shapes created on a coordinate plane.
Curated OER
Calculate It
Fourth graders find the area and perimeters of squares and rectangles using a calculator to check their multiplication. They use the appropriate formulas to find the area and perimeter of the given geometric shapes.
EngageNY
Polynomial, Rational, and Radical Relationships
This assessment pair goes way beyond simple graphing, factoring and solving polynomial equations, really forcing learners to investigate the math ideas behind the calculations. Short and to-the-point questions build on one another,...
Statistics Education Web
The Case of the Careless Zookeeper
Herbivores and carnivores just don't get along. Using a box of animal crackers, classes collect data about the injury status of herbivores and carnivores in the box. They complete the process of chi-square testing on the data from...
Curated OER
Mean, Median, Mode, etc.
Explore the concept of mean, median, and mode with pupils. They estimate the length of a string or the number of M&M's in a jar. Then find the mean, median, and mode of the class' estimates.
PBS
Frame Yourself: Area and Perimeter
Elementary schoolers are arranged in pairs and view the video Math Works: Measurement: The Difference Between Perimeter and Area. They discuss any prior knowledge they have of the term perimeter and then brainstorm together what the...
Flipped Math
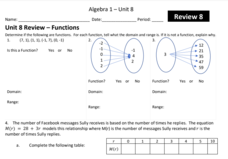
Unit 8 Review: Functions
Let's finish a functional review. Pupils work through 31 items to review the concepts learned in Unit 8. Scholars determine whether a mapping is a function and identify the domain and range. Using function notation, individuals then...
Curated OER
Linear Piecewise Functions
Students explore the concept of piecewise functions. For this piecewise functions lesson, students graph piecewise functions by hand and find the domain and range. Students make tables of values given a piecewise function. Students write...
Curated OER
Radical Transformations
Students transform the square root function graphically. In this transforming the square root function graphically lesson, students use their Ti-Nspire to change the a, b, and c values of th square root graph. Students transform the...
Curated OER
Calculate the Slope of a Line Using Two Points
Find that slope! This video does an excellent job of demonstrating how to use the slope formula to find the slope of a line using two points. The instructor first reviews the definition of slope of a line, then works three problems using...
Virginia Department of Education
Curve of Best Fit
Which function models the data best? Pupils work through several activities to model data with a variety of functions. Individuals begin by reviewing the shapes of the functions and finding functions that will fit plotted data points. By...
Curated OER
Worksheet #2.6: MT-A141 PreCalculus
In this graphing worksheet, students predict how a graph of given functions will work. Next, they check their work using a graphing calculator. Students use algebra to complete the graph of a square and determine transformations.
Curated OER
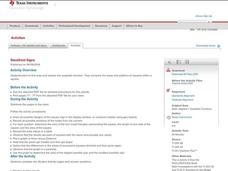
Storefront Signs
Learners practice finding the areas and patterns within a square and explore the concept of quadratic functions. They observe and record the area values in a table, plot a graph of Area versus Distance and complete a variety of student...
Curated OER
The Closer I Get To You
Pupils explore the law of reflection. Through experimentation and problem solving, they collect and analyze data pertaining to reflection. The data is plotted on a graph and formulas for calculating the x and y values are evaluated.
Curated OER
Scatterplots
In this scatterplots worksheet, students construct a scatter plot from a given data set. Students then answer 4 questions regarding the least-squares regression line and making predictions.
Curated OER
Solve-Real roots-Intersections
For this math worksheet students complete a series of multiple choice questions including calculating intersections using x and y axis.
Curated OER
Proof of the Pythagorean Theorem Using Transformations
Middle and high schoolers construct a triangle using Cabri Jr. They construct squares on each of the legs and hypotenuse of the triangle. Pupils show that the area of the squares on the leg equal the area of the square on the hypotenuse.
Curated OER
Square Roots, Number Classification, Ordering & Graphing
Ninth graders identify numbers as rational or irrational. Using calculators estimation, and factoring methods, 9th graders compute the square root of numbers. They graph numbers in sequential order and round numbers integers to the...


