Curated OER
Investigating Velocity Effects at Takeoff
Learners use, with increasing confidence, problem-solving approaches to investigate and explain mathematical content. They make and test conjectures. They use tables and graphs as tools to interpret expressions, equations, and inequalities.
Computer Science Unplugged
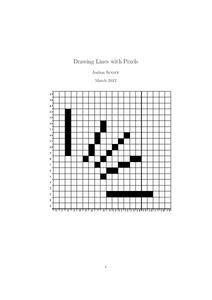
Drawing Lines with Pixels
How do the computers keep it straight? Using the provided algorithms, class members draw a line and a circle using pixels. They then check the drawings using a straight edge and compass to determine the accuracy of their drawings.
Curated OER
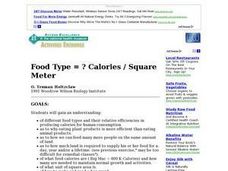
Food Type And Calories Per Square Meter
Students compare the efficiency of producing food calories in different types of food then calculate how much land is required to supply their food for a year. They then graph the results.
Curated OER
One Square Foot
Students identify, describe, count, tally, and graph life found in one square foot of land.
Alabama Learning Exchange
Explore the Transformations of Linear and Absolute Value Functions Using Graphing Utilities
Students explore the concept of transformations. For this transformation lesson, students use an applet that is an interactive absolute value graph applet. Students manipulate the applet to examine the change in the function and how it...
Curated OER
Area
Students examine the mathematical concept of area. These activities and discussions may be used to develop students' understanding of this mathematical concept and will enable students to calculate the area of a random shape on a grid.
Inside Mathematics
Quadratic (2009)
Functions require an input in order to get an output, which explains why the answer always has at least two parts. After only three multi-part questions, the teacher can analyze pupils' strengths and weaknesses when it comes to quadratic...
Teach Engineering
Air Pressure
Investigate what is pushing on us. An intriguing lesson has pupils calculate the amount of force on various squares due to air pressure. Using the data, individuals create a graph in the third lesson of the Up, Up and Away unit...
Radford University
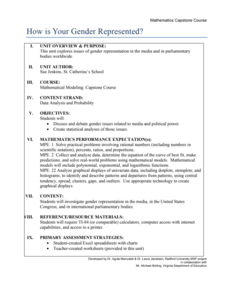
How Is Your Gender Represented?
Does the media shape people's views on gender? Scholars use data on gender portrayal in magazines to explore the idea. They use a spreadsheet program to create bar graphs and perform a chi-square test. They also use provided data to...
Curated OER
Does Sunlight Effect Leaf Size?
Students make estimates and then measure leaves for accuracy. They calculate the area of the leaves by drawing an outline on graph paper and counting the squares. They compare the leaves exposed to sunlight to those that are in constant...
Curated OER
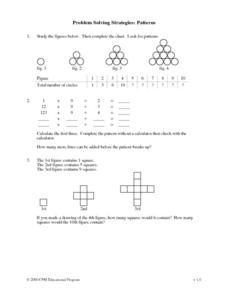
Problem Solving Strategies: Patterns
What's next in the series? Mathematicians study figures, graphs, and statements to determine what comes next in this patterns learning exercise. They experiment with a multiplication chart and draw their own figures to continue specific...
Curated OER
Count on Me
Fourth graders use inductive reasoning to find algebraic patterns in geometric figures. They use technology (i.e., calculators, computers) and manipulatives to discover number patterns involving geometric concepts. They solve concrete...
Curated OER
Translate Word Phrases and Sentences into Equations
Use this video to show your learners an example of how to translate word phrases into an equation to solve a real-world problem. The presenter begins with a review of how to use cross products to solve a proportion, including how to do...
Curated OER
Turn Up the Volume
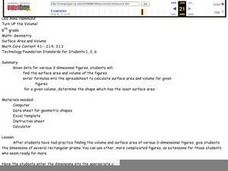
Measuring volume can be a mystery for 5th graders, but this hands-on activity gives the gift of discovery. The volume of simple rectangular solids and irregular shapes are calculated through various methods including displacing liquid in...
Curated OER
Annual Wetland Plant Diversity Survey
Students locate an area of marsh and, by measuring the total number of individual plants in a sample area, determine whether purple loosestrife population density is correlated to the total plant diversity of the community. They...
Illustrative Mathematics
Zeroes and factorization of a non polynomial function
Functions behaving badly: the squaring function and the absolute value function are both zero at x=0. Yet when you divide each by x, different things happen. Here, your class will explore each scenario as a means to adding depth to their...
Curated OER
Greatest and Least Area - Enrichment 18.3
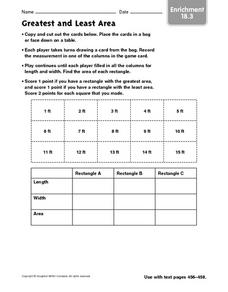
In this greatest and least area game worksheet, students cut out the cards, draw a card and record the measurement in the length or width column of a graph. When all columns have been filled, they calculate the areas to find the winner...
Illustrative Mathematics
Irrational Numbers on the Number Line
There are four irrational numbers that participants need to graph. Pi(π), -(½ x π), and √17 are easy to approximate with common rational numbers. On the other hand, the commentary describing the irrational number 2√2 is not clear. It...
Curated OER
Lift/Velocity Relationship Problem Set
Students, after reading an explanation from a NASA Web-based textbook, demonstrate their ability to use, graph (using a graphing calculator), and interpret a text equation.
Curated OER
Unit Plan On Quadratic Equations
Students explore a variety of ways of solving quadratic equations. Students choose from graphing, factoring, finding square roots, completing the square and using the Quadratic formula. They ponder in the end on polynomial equations.
Curated OER
Count The Letters
Students perform activities involving ratios, proportions and percents. Given a newspaper article, groups of students count the number of letters in a given area. They use calculators and data collected to construct a pie chart and bar...
Curated OER
Exponential Decay
Students study exponential decay and its application to radiocarbon dating. In this exponential decay lesson, students use candy to model the time it takes for something to decay. Students also graph the data they collect and describe...
Curated OER
If you have to find the area of a region, how would you calculate it?
Fifth graders find the area of rice farms. In this area lesson, 5th graders draw shapes and grid them to find the area. They compare different rice fields to see which one takes up more space and has the larger area.
Curriculum Corner
8th Grade Math "I Can" Statement Posters
Clarify the Common Core standards for your eighth grade mathematicians with this series of classroom displays. By rewriting each standard as an achievable "I can" statement, these posters give students clear goals to work toward...


