Curated OER
Graphing and Interpreting Linear Equations in Two Variables
Graph linear equations using a table of values. Learners solve equations in two variables using standard form of an equation. They identify the relationship between x and y values.
Curated OER
Digger and the Gang
Help online friends Digger and Sprat from the BBC series to solve math problems! In a series of activities, your class will use data sets to calculate measurements, averages, means, and probabilities. The class completes worksheets and...
Curated OER
Data With Candy
Students, while utilizing the classroom and the computer lab with a bag of colored candy, gather and interpret data, calculate averages and draw conclusions and draw a bar graph. They estimate how many candies are in the bag, what...
Curated OER
Sweet Data
Students input data about the colors of their serving of M&M candies onto a spreadsheet. They create charts and graphs based on this information.
Curated OER
Counting
First graders explore collecting data. They collect data using a data collection sheet and enter the data into Excel. Students create graphs using Excel. They share their graphs with the class.
Curated OER
Fire!, Probability, and Chaos
Upper elementary and middle schoolers work with the concept of probability. They are introduced to the concept of chaos. Learners graph and analyze using a line plot, work with mean, and are introduced to the concept of variance.
Curated OER
Soil Excavation
Students comprehend how percent of change and multipliers are used to determine volume for removal and replacement of soils. They calculate soil volume percent changes using data tables. They apply formulas to solve a variety of...
Curated OER
What is the Average Height of Your Class?
In this statistics lesson plan, learners use an on-line form generator create a class-specific form, then complete the form, view a graph and data analysis, and draw conclusions.
Curated OER
Classroom Supplies
Challenge young mathematicians to buy classroom supplies by staying within the means of a $1,000 budget. The mathematical activity provides learners with the opportunity to decide what items from the supply list would benefit a class of...
Curated OER
Shaquille O'Neal Hand & Foot Span
If Shaquille O'Neal wears a size-20 shoe, how big are his hands? Learners will use the average ratios of foot length to hand span to calculate the hand span of Shaq, but first, they have to collect the data! They will...
Curated OER
Mystery Liquids: Linear Function
High schoolers determine the linear equations of the density of water and oil by collecting data on the mass of various volumes of each liquid. They construct scatter plots from the data and use these to write the linear equations for...
Curated OER
Sums and Difference of Cubes
Learners factor polynomials using the sum and difference of cubes. They also learn connections between the graph and expression.
Curated OER
Quadratic Formula
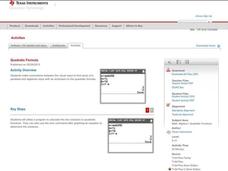
This worksheet is part of the TI-Nspire lesson on the quadratic formula. Pupils determine the solutions of a quadratic function by looking at a graph and the discriminant. They use the quadratic formula to solve quadratic functions on...
Teachers Network
A World of Symmetry: Math-Geometry
Define and identify the three basic forms of symmetry translation, rotation, and glides with your class. They cut out and arrange paper pattern blocks to illustrate symmetry, create a Cartesian graph, and design a rug with a symmetrical...
Curated OER
How Long Can You Go?
Eighth graders examine the usefulness of a line of best fit by collecting and graphing data, using a graphing calculator to determine the line of best fit, and making a variety of predictions. They watch a video, then design a...
EngageNY
Analyzing Residuals (Part 1)
Just how far off is the least squares line? Using a graphing calculator, individuals or pairs create residual plots in order to determine how well a best fit line models data. Three examples walk through the calculator procedure of...
Curated OER
Get a Half Life!: Student Worksheet
Upper elementary or middle schoolers will explore non-linear functions, graphing, and the curve of best fit through real-life data collection and trial analysis. They explore the concept of half-life and radioactive decay using M&Ms,...
Curated OER
Systems of Linear Equations
Introduce the inverse matrix method to solve systems of linear equations both algebraically and graphically. Using given data, your class checks their answers with graphing calculators. Handouts are included in this well-thought out lesson.
Inside Mathematics
Swimming Pool
Swimming is more fun with quantities. The short assessment task encompasses finding the volume of a trapezoidal prism using an understanding of quantities. Individuals make a connection to the rate of which the pool is filled with a...
Curated OER
Basketball Rebounds
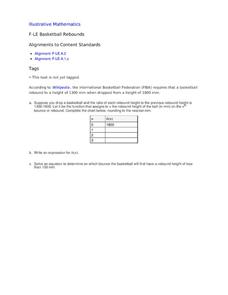
Your young basketball players will build a table and develop a general formula for a decaying exponential scenario involving the rebound distance of a bouncing ball. Using a CBR and graphing calculator can make this even more hands-on...
Willow Tree
Slope
Investigate the different types of slope using graphs and ordered pairs. Scholars use the slope formula to determine the slope of a line between two points. Includes examples with a slope of zero and with no slope. The lesson follows a...
CK-12 Foundation
Expected Value: Win a Dollar
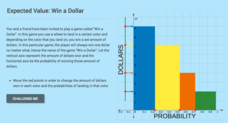
Spin a wheel, land on a color ... and win. Learners create a graph to display the probabilities of the amount of money they can win by spinning a colored wheel. The pupils use the dollar amounts and their probabilities to calculate the...
Teach Engineering
Ranking the Rocks for Desired Properties
Math rocks! Cavern design teams determine the rankings of rock types based upon desirability points. The points are connected to the properties of the rocks and their usefulness in building a cavern.
University of Colorado
Solving a Mixed Up Problem
Begin the process of adding and subtracting spectra. Having a basic understanding of occultation events, pupils begin the pursuit to determine what a found atmosphere might contain. Learners work with two graphs and calculate what the...


