Curated OER
Exploring Permutations and Combinations with the Graphing Calculator
In this permutations and combinations learning exercise, high schoolers solve 30 short answer problems. Students determine the number of permutations and combinations possible given a scenario.
Curated OER
Graphing Calculator Investigation - Second Degree Polynomial Functions
Young scholars solve quadratic functions. In this solving quadratic functions lesson, students determine the height of an object at a given time. Young scholars determine the time at which an object hits the ground. Students answer...
Discovery Education
Sonar & Echolocation
A well-designed, comprehensive, and attractive slide show supports direct instruction on how sonar and echolocation work. Contained within the slides are links to interactive websites and instructions for using apps on a mobile device to...
Curated OER
Quadratic Equations with the CBL 2
Learners practice generating parabolas with a motion sensor while determining the vertex form of the equation. They compare it to the regression equation from the calculator onto a data mate software. Each student completes several...
Curated OER
Murder in the First Degree - The Death of Mr. Spud
Secondary learners investigate exponential functions in a real-world scenario. They collect data on the temperature of a cooling baked potato, enter the data into lists, and graph the data using a scatter plot before finding an...
Curated OER
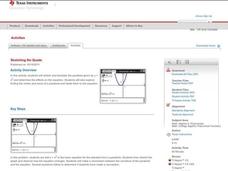
Stretching the Quads
Scholars investigate transforming parabolas. In this transforming parabolas lesson, they take the parent graph y=x^2 and transform it by shifting left, right, up, and down and shrinking and stretching. The class finds maximums,...
National Council of Teachers of Mathematics
Stitching Quilts into Coordinate Geometry
Who knew quilting would be so mathematical? Introduce linear equations and graphing while working with the lines of pre-designed quilts. Use the parts of the design to calculate the slope of the linear segments. The project...
Curated OER
Agriculture and the Government
Students study the government's involvement in the U.S. A's food production and make connections relating to farm programs. In this historical agriculture lesson plan, students read content and research significant information....
Curated OER
Mean, Median, and Mode
Eighth graders practice using the LIST key on graphing calculators using the proper syntax. They work with the functions of mean, median, and mode in a teacher led lesson and then with a partner on a second data set. They follow...
Curated OER
Graph Lab
Seventh graders explore bar graphs and pie charts. Given a pack of M&Ms, 7th graders explore the colors, sort the data in a frequency chart and then construct bar graphs and pie charts to categorize the M&Ms by color. Students...
Curated OER
Polynomial Functions
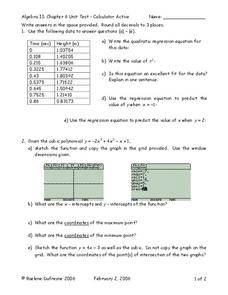
In this Algebra II worksheet, 11th graders use a graphing calculator to determine the regression equation of the given data, graph polynomial functions, factor polynomials, and determine the quotient and remainder in polynomial division....
Curated OER
More on Limits, Graph Sketching, and L'Hopital's Rule
For this limits worksheet, students compute the answers to thirteen limits problems. They answer one short answer question. Students follow listed steps to simplify two limits problems. Students answer three short answer questions about...
Curated OER
Trigonometry Practice: Trigonometric Graphs #3
For this Trigonometry Practice worksheet, students are asked to graph a variety of trigonometric functions. A graphing calculator is required to complete these three pages.
Curated OER
Graphing Functions With 2 Points and From a Graph
Learners plot points on a coordinate plane. They describe, in words, methods for finding the slope of a line. After given a worksheet, students read instructions, draw a Cartesian plane, plot ordered pairs, and graph lines. Papers are...
Curated OER
Range and Mode
Students interpret data from graphs. In this range and mode instructional activity, students review a tally chart, pictograph and bar graph. Students use these graphs to calculate the range and mode of each set of data.
Virginia Department of Education
Numbers in a Name
What's in a name? Pupils create a data set from the number of letters in the names of classmates. Each group then takes the data and creates a visual representation, such as a histogram, circle graph, stem-and-leaf plot, etc.
Curated OER
Designing Models to Simulate Actual Events Using a Random Number Generator
Students design models to simulate actual events using a random number generator on a calculator. They estimate the likelihood of a particular outcome using results of simulations. Answer Key included.
Curated OER
Shedding Light on the Weather with Relative Humidity
Learners study weather using a graphing calculator in this lesson plan. They collect data for temperature and relative humidity for every hour over a day from the newspaper, then place the data in their handheld calculator and examine it...
Curated OER
Geometric Sequences and Series
Learners find common ratios of geometric sequences on a spreadsheet. Using this data, they create scatter plots of the sequences to determine how each curve is related to the value of the common ratio. They will consider whether series...
Curated OER
The Great Race
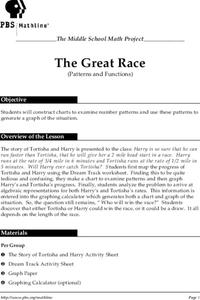
Students are presented with a story about two individuals running a race in which one is given a head start. Students must map the progress of the runners, create a chart examining patterns and graph the progress. In the end, students...
Texas Instruments
Light and Day
Pupils explore the concept of collecting data as they collect data on their graphing calculator about time, temperature, and light. Learners plot the data and create histograms and box and whisker plots to analyze the data.
Curated OER
Spaghetti Palace
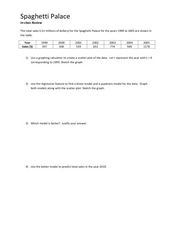
In this spaghetti palace activity sheet, students examine data and create a scatter plot. They use their graphing calculator to find a linear model and a quadratic model for given information. Students predict total...
Curated OER
Coordinate Graphs, Translations and Reflections
Young scholars perform translations and reflections. In this algebra lesson, students use the TI calculator to graph functions. They move the functions around on the coordinate plane using translation and reflection.
Curated OER
Coin Tossing and Graphing
Fifth graders use technology as assistance to collecting random data. Through the random data they will be able to explain the significance of getting a head or tail depending on what was previously landed on. They will then analyze the...


