Noyce Foundation
Sewing
Sew up your unit on operations with decimals using this assessment task. Young mathematicians use given rules to determine the amount of fabric they need to sew a pair of pants. They must also fill in a partially complete bill for...
EngageNY
Changing the Base
I can't calculate a base-2 logarithm since my calculator doesn't have a base-2 log key. Young mathematicians use the change of base formula to extend the properties of logarithms to all bases. Among these bases is the natural log base,...
Virginia Department of Education
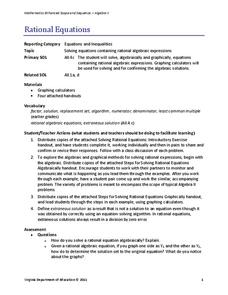
Rational Equations
Provide guidance and practice of the useful skill: solving rational equations using both an algebraic and graphical approach. Pupils solve increasingly more difficult rational equations using algebraic methods. After, they...
Virginia Department of Education
Normal Distributions
Pupils work to find probabilities by using areas under the normal curve. Groups work to calculate z-scores and solve real-world problems using the empirical rule or tables.
Concord Consortium
All-in-All Problems
Graphs, functions, symbols, and more! Use these strategies to model everything from the flow of a river to the number of cars passing a toll booth. Presented differently but solved similarly, learners consider five different scenarios...
California Education Partners
Summer Olympics
Quickly get to the decimal point. The last assessment in a nine-part series requires scholars to work with decimals. Pupils compare the race times of several athletes and calculate how much they have improved over time. During the second...
EngageNY
Modeling with Quadratic Functions (part 2)
How many points are needed to define a unique parabola? Individuals work with data to answer this question. Ultimately, they determine the quadratic model when given three points. The concept is applied to data from a dropped...
Point Pleasant Beach School District
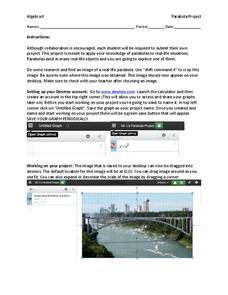
Parabola Project
Class members select a picture that contains a parabola and construct a drawing of it using function graphs in the quadratic project. Individuals restrict the domains of the functions to create a more accurate drawing. They then submit a...
Curated OER
Shaquille O'Neal Hand/Foot Span
Shaquille O'Neal has huge hands and feet, and learners will use those two measurements to practice collecting and extrapolating data using ratios. They record the measurement of foot and hand span of several of their classmates, then...
Virginia Department of Education
Average Atomic Masses
Facilitate learning by using small objects to teach the principles of atomic mass in your science class. Pupils determine the average mass of varying beans as they perform a series of competitive experiments. They gather data and...
Inside Mathematics
Coffee
There are many ways to correlate coffee to life, but in this case a learning exercise looks at the price of two different sizes of coffee. It requires interpreting a graph with two unknown variables, in this case the price, and...
PBS
Adventures With The Fish Pond: Population Modeling
Build up from the previous activity where your learners charted the population growth and decay of a fish pond with M&Ms®. Have them look at the data from that activity and create a Now-Next, or recursive equations, to predict the...
EngageNY
Comparing Rational Expressions
Introduce a new type of function through discovery. Math learners build an understanding of rational expressions by creating tables and graphing the result.
Statistics Education Web
NFL Quarterback Salaries
Use statistics to decide if NFL quarterbacks earn their salaries! Learners study correlation coefficients after using technology to calculate regression equations. Through the data, they learn the meaning of correlation and correlation...
Noyce Foundation
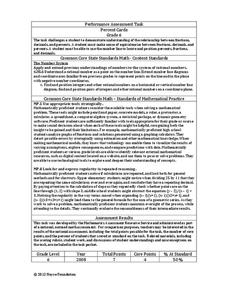
Percent Cards
Explore different representations of numbers. Scholars convert between fractions, decimals, and percents, and then use these conversions to plot the values on a horizontal number line.
Mascil Project
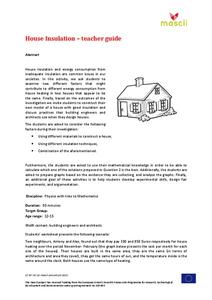
House Insulation
Make sure your house is warm in the winter. Pupils analyze graphs of heating costs for two similar houses and make hypotheses for why the costs differ. They then build models of houses with appropriate insulation to reduce heating costs.
Radford University
A Change in the Weather
Explore the power of mathematics through this two-week statistics unit. Pupils learn about several climate-related issues and complete surveys that communicate their perceptions. They graph both univariate and bivariate data and use...
5280 Math
More or Less the Same
Tell the story of the math. Given a graph of a linear system, learners write a story that models the graph before crafting the corresponding functions. Graphs intersect at an estimated point, allowing for different variations in the...
Curated OER
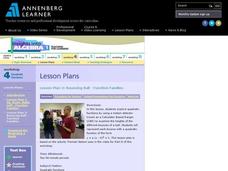
Bouncing Ball : Function Families
A bouncing ball serves as more than entertainment when learning to apply quadratic functions to real-world events. This is the second of a two-part lesson, which can also be accessed from the website. The instructions say to measure the...
Mathed Up!
Tallys and Charts
After watching a brief instructional video, young mathematicians are put to the test. By completing and reading frequency tables, tally charts, and bar graphs, individuals show their understanding of how to interpret data.
02 x 02 Worksheets
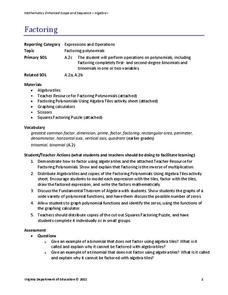
Factoring
Factor in this resource when teaching how to factor polynomials. Scholars use algebra tiles to factor linear and quadratic expressions. They practice their skill by working on example problems from a worksheet.
Space Awareness
The Climate in Numbers and Graphs
Weather versus climate: weather relates to short time periods while climate averages the weather of a period of many years. Scholars learn about average temperature and precipitation in various climate zones and then apply statistics...
California Education Partners
Least and Greatest
Squares can be magic. Pupils use their knowledge of addition of positive and negative rational numbers to create a 3 X 3 magic square where the sums are 1. Scholars create addition and multiplication expressions with a set of rational...
Curated OER
Performance-Based Assessment Practice Test (Grade 6 Math)
Keep track of your sixth graders' mastery of the Common Core math standards with this practice assessment. Taking a different approach than most standardized tests, this resource includes not only multiple choice questions, but also...


