EngageNY
Vectors in the Coordinate Plane
Examine the meaning and purpose of vectors. Use the lesson to teach your classes how find the magnitude of a vector and what it represents graphically. Your pupils will also combine vectors to find a resultant vector and interpret its...
EngageNY
Comparing Irrational Numbers
Build on your classes' understanding of irrational numbers by comparing their values. The 13th lesson in the 25-part module has individuals estimate values of both perfect and non-perfect roots. They finish by graphing these numbers on a...
EngageNY
Finding One Hundred Percent Given Another Percent
Class members solve problems to find the whole when given a percent. They use double line numbers and factors of hundred to help break the 100 percent into equal segments.
02 x 02 Worksheets
Slope
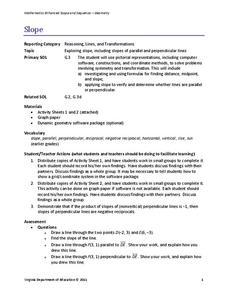
What does slope have to do with lines? Pupils work with lines and determine the slope of the lines informally and with the slope formula. Groups use their knowledge to calculate the slopes of parallel and perpendicular lines. They also...
PBL Pathways
What Should Have Happened on Gilligan's Island?
"Just sit right back and you'll hear a tale ..." Gilligan's Island is a classic that spans generations and offers a problem-solving opportunity for scholars. Take a project-based learning approach to examine the population of the island....
The New York Times
Understanding the Mathematics of the Fiscal Cliff
What exactly is the fiscal cliff? What are the effects of changing income tax rates and payroll tax rates? Your learners will begin by reading news articles and examining graphs illustrating the "Bush tax cuts" of 2001 and 2003. They...
Bowland
Ice Cream
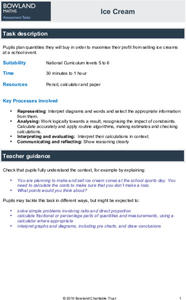
Make sure there is enough ice cream on hand. Learners try to find out how much ice cream to buy for a sports event. Scholars use a pie chart showing the percent of a sample of people who like different flavors of ice cream. Using the...
Curated OER
Converting Units Of Length
Use this converting units of length worksheet to have your charges fill out a table, find the perimeters to three shapes and calculate the answers to three word problems.
Virginia Department of Education
Mathematics Vocabulary Cards - Kindergarten
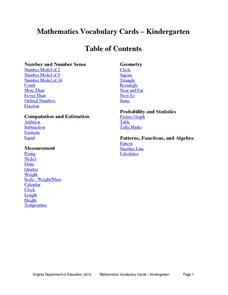
Enhance your math lesson with a series of pictures that illustrate different math concepts. The vocabulary includes a variety of ideas and pictures including fractions, ordinal numbers, picture graphs, and number lines.
West Contra Costa Unified School District
Interest and the Number e
Mary, Mary, quite continuously, how does your money grow? Uses examples to examine the difference between simple interest and compound interest, and to take a look at different rates of compounding. Learners explore what would...
EngageNY
Examples of Dilations
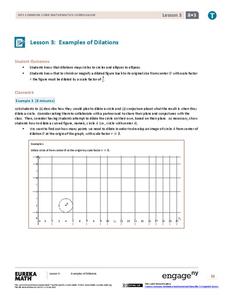
Does it matter how many points to dilate? The resource presents problems of dilating curved figures. Class members find out that not only do they need to dilate several points but the points need to be distributed about the entire curve...
Curated OER
College Education
What do Bill Gates and Mark Zuckerberg have in common? They're both billionaires, and neither one has a college degree! Using the website, scholars explore whether having a college education is truly worth the money it costs. They read...
Virginia Department of Education
Transformationally Speaking
Young mathematicians explore transformations of graphs by graphing sets of functions on the same pair of axes. They use their graphs to determine the effect that the values of a and b in y = ax + b have on the graph of y = x.
Curated OER
Linear Piecewise Functions
Students explore the concept of piecewise functions. In this piecewise functions lesson, students graph piecewise functions by hand and find the domain and range. Students make tables of values given a piecewise function. Students write...
Curated OER
The Way to Better Grades!
Pupils collect and analyze data. For this statistics lesson, learners create a scatter plot from their collected data. They use, tables and graphs to analyze the data and mae decisions.
Curated OER
Density of a Paper Clip Lab Review
Even though this assignment is brought to you by Physics Lab Online, it is best used as a math practice. Middle schoolers calculate the range, mean, mode, and median for a list of eight different paper clip densities. They analyze...
Curated OER
The Race of Baseball All-Stars
Collect and analyze data. Pupils graph their data and model with it to solve real life problems. They use logic and deductive reasoning to draw conclusions.
Curated OER
Linear Inequalities in One and Two Variables: Rays and Half Planes
Define rays and half planes, including the concepts of boundary lines and prerequisite knowledge of coordinate planes. Given linear inequalities in one and two variables, your class will compare the differences. They will also graph...
Curated OER
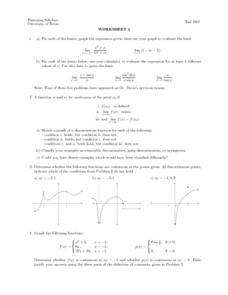
Worksheet 4: Limits
In this limits worksheet, students evaluate limits and graph given expressions. They classify graphs as removable discontinuities, jump discontinuities, or asymptotes. this two-page worksheet contains seven multi-step problems.
Alcohol Education Trust
Talk About Alcohol: How Much Alcohol is in a Drink?
Introduce your class to alcohol content. In order to become aware of the varying strengths of alcoholic drinks, class members complete a chart and plot a bar chart with the results. They make observations about the results.
Curated OER
How Deep Do They Dive
Pupils calculate and graph the diving depths of various types of whales. They cut out and glue whale pictures on a worksheet to represent the diving depths for five whales, and discuss how people use graphs to communicate.
Curated OER
Virtual Field Trip
This hands-on resource has future trip planners analyze graphs of mileage, gasoline costs, and travel time on different routes. While this was originally designed for a problem-solving exercise using a Michigan map, it could be used as a...
Curated OER
Is the Rainbow Fair?
Third graders perform statistical calculations. Given a bag of Skittles, 3rd graders sort and collect data regarding the colors included in their bag. Using spreadsheet software, students create a bar graph of the information collected....
Virginia Department of Education
Spring Fling Carnival
Think critically — and linearly by applying linear equations to solve real-world problems. Young mathematicians write equations to model the profit on popcorn and cotton candy at a carnival and solve problems using these equations.


