Curated OER
Lesson 2 Ordering Numbers
Math wizards begin the lesson by comparing and ordering rational numbers. Using a number line, they discover the relationship between the numbers and practice ordering them in the correct way. They also review proper techniques for...
Curated OER
Virtual Field Trip
Are we there yet? Young trip planners learn about their state and plan a trip. They will select sites to see in three cities in their state, and record associated costs in a spreadsheet. While this was originally designed as a...
Curated OER
Curved Lines
In this curved lines worksheet, students examine equations that, when graphed, present a curved line. They explore specified points on the graphed line and write an equation for the tangent line at given points. This two-page worksheet...
Curated OER
Tune...Um!
High schoolers collect real data on sound. In this algebra lesson plan, students use a CBL and graphing calculator to observe the graph created by sound waves. They draw conclusion about the frequency of sound from the graph.
Curated OER
TOPSY TURVY MAPS
Eighth graders use the data analyzer and motion detector to collect data and measure distances. They create topographic maps drawn to scale of a given setup and relate the concepts to the creation of historical ocean maps.
Curated OER
Lines of Best Fit
Students determine if there is an associationm in a scatter plot of data. They analyze data through predictios, comparisons, and applications. Students calculate the line of best fit using a graphing calculator. They display data in...
Curated OER
Solving Systems of Equations
In this systems of equations activity, students use a graphing calculator to solve systems of equations. Examples and step-by-step instructions for using the graphing calculator are provided. This two-page activity contains two...
Curated OER
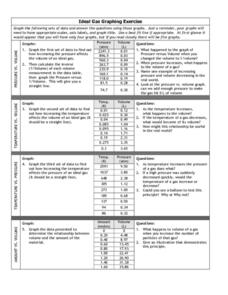
Graphing Exercise of Ideal Gas Data
In this graphing of Ideal Gas Data learning exercise, students use the given data to draw 4 graphs of the given data. They are given the pressure and volume to draw and interpret the graphs.
Curated OER
Graphing Linear Functions
Learners practice solving systems of linear equations using the substitution and elimination methods. They determine if the system has one, infinite or no solution. Students also graph the linear equations.
Curated OER
Graphing Absolute value Inequalities
High schoolers investigate the concept of inequalities and practice graphing them at various degrees of difficulty. They review the basic rules with the teacher at the level of theory which may make it harder for them to understand...
Curated OER
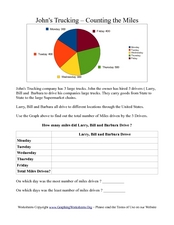
John's Trucking- Counting the Miles
In this graphs worksheet, students analyze a pie graph showing miles driven by three truck drivers in a week. Students fill out a chart in which they calculate total miles driven.
Curated OER
Finding Extrema Graphically and Symbolically
In this extrema instructional activity, students use graphing calculators and the optimization method to identify the maximum and minimums of a given function. They compute the first and second derivative, and graph the functions. This...
Curated OER
Finding the Extrema Graphically and Symbolically
For this extrema worksheet, students use the first derivative test and the second derivative test to determine the local extrema. They identify the local maximum and global maximum. This eight-page worksheet contains detailed...
Curated OER
Exploring Linear Equations
Eighth graders follow the teacher as they enter information into the graphing calculator. They investigate different graphs to explain the slope of a line, the y intercept, and parallel lines.
Curated OER
The Wave of the Future
Twelfth graders discuss sine curves and enter equations into their graphing calculator then compare different graphs created on their calculators. They identify the period, amplitude and phase shift given the graph or the equation of a...
Curated OER
Math Handbook: Trigonometry
You'll be spinning in unit circles once you read through this jumbo-sized resource of everything you need to know about trigonometry. Each page has color-coded examples with explicit directions that detail the problems and...
Curated OER
Dilations in the Plane
Tenth graders investigate dilations and explore the dilation transformation before investigating the properties of a dilation using Cabri Jr. High schoolers extend the concept of dilatation to the coordinate plane.
Mathalicious
Domino Effect
Carryout the lesson to determine the cost of pizza toppings from a Domino's Pizza® website while creating a linear model. Learners look through real data—and even create their own pizza—to determine the cost of each topping. They...
Columbus City Schools
To Measure its Mass or Volume?
Atoms, elements, and molecules, oh my! Teaching the fundamentals of chemistry to curious sixth graders has never been easier to accomplish. Here is a resource that pulls together everything needed to get them off to a good start,...
Curated OER
Functions of Algebra
Learners use technology graph and evaluate linear inequalities. They write and manipulate inequalities for use on a graphing calculator. In addition they apply their skills to analyze inequalities. Answer Key included.
Curated OER
Matricies: Meadows or Malls?
Students explore the use of matrices and graphing calculators to solve a complex linear programming problem. They test their solutions to determine the best division of land use for the city.
Curated OER
Functions & Algebra
Students examine linear equations. In this functions and algebra lesson, students write equations in the slope-intercept form. They enter data in a graphing calculator, examine tables, and write linear equations to match the data.
Curated OER
Getting Triggy With It
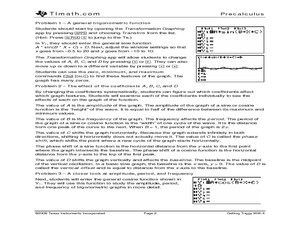
The concept of sine and cosine is explored in this lesson where students graph sine and cosine graphs using a transformation application on the graphing calculator. Students change the coefficients for the amplitude, period,...
Curated OER
Rhinos and M&M's
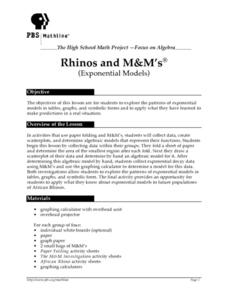
Students analyze patterns of exponential models by collecting data in paper folding and M&M investigations. They use graphing calculators to create scatter plots that lead to equations for the exponential models. They then apply this...


