Curated OER
Linear Relationships - Standard Form
Students use a graphing calculator to examine the association between the data points and equation of a linear relationship. They write equations in standard form and then graph the equations using the slop-intercept form. Answer Key...
Curated OER
Calculus Exam
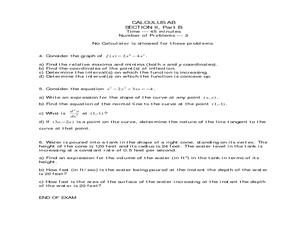
In In this calculus worksheet, student solve 6 multi-step problems involving volume, intervals, acceleration, and graphing. A graphing calculator will be necessary to complete the worksheet.
Curated OER
The Slope of a Line
Learners define the slope of a line as rate of change. They investigate positive, negative, zero, or undefined slope using a graphing calculator. They determine the slope of a line when given the equation of the line.
Curated OER
Linear Relationship
Students use a graphing calculator to examine the association between the data points and equation of a linear relationship. They write equations in slope- intercept form. Answer key included.
Curated OER
Who Let the Dogs Out?
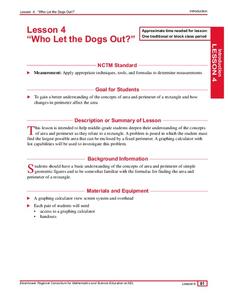
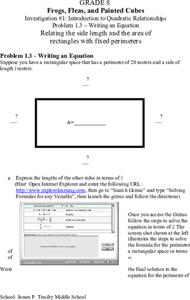
Students examine the concepts of area and perimeter and how they relate to a rectangle. They find the largest possible area that can be enclosed by a fixed perimeter and complete a worksheet as well as create a table of all the possible...
Curated OER
Connecting Factors and Zeros
In this Algebra II lesson, students explore the connection between the factored form of a quadratics and the zero of a function. Students use a graphing calculator to verify factoring numerically and graphically.
Curated OER
Solve Multistep Equations
In this multi-step equations instructional activity, 9th graders solve and complete twenty-four different problems that include using a graphing calculator to complete. First, they solve for x in the first section. Then, students solve...
Curated OER
Introduction to Quadratic Equations
In this quadratic equations worksheet, 8th graders solve and complete 7 various types of problems. First, they find the area for each rectangle with a given perimeter. Then, students describe the shape of the graph and use the equation...
Michigan Sea Grant
Water Quantity
It may be tricky for a young mind to conceptualize that less than 1% of all water on earth is useable for humans to drink. Simulating the amount of fresh water available on earth by removing measured amounts of water from a five-gallon...
Curated OER
Walking on Air
Students collect and analyze data with a graph. In this statistics lesson, students use central tendencies to find the meaning of their data. They display the data on a Ti calculator.
Curated OER
Means of Growth
Pupils collect and graph data. In this statistics lesson, students analyze their plotted data using a scatter plot. They identify lines as having positive, negative or no correlation.
Curated OER
Where Did We Go on Holiday This Year?
In this differentiated whole-group activity worksheet, students list all the places they visited over the summer, record the places on a flip chart, calculate the distances on a road map and graph the data they collect.
Curated OER
Let's Go Slopey
Pupils create a table of values to graph a line. For this algebra lesson, students identify the slope and intercept of a linear equation. They use a Ticalculator to graph their function.
Curated OER
What "Ohm's" You?
Students use the CBL and voltage probe to observe electricity. In this algebra instructional activity, students use the TI calculator with the CBL to explore Ohm's Law. They discuss exponential equations and how it relates to...
Curated OER
Slopes and Lines
Students identify the slopes of a line. In this algebra lesson, students calculate the slope and intercept of a line. They graph their lines using a TI calculator.
Curated OER
Quadratic Applications
In this quadratic applications worksheet, students complete graphs, charts, comparison charts, and more having to do with quadratic equations. Students complete 5 different activities.
Curated OER
Lahar Travel Time
Ninth graders analyze published geologic hazard maps of California and comprehend how to use the map's information to identify evidence of geologic events of the past and present and predict geologic changes in the future. They select...
Curated OER
Calculating Speed
Fourth graders complete an experiment on calculating speed. In this speed calculation instructional activity students complete an activity in which they have dominoes fall as slow as possible.
Curated OER
Finding a Line of Best Fit
Pupils engage in the practice of creating a scatter plot with the data obtained from measuring different resting heart rates. The data is used to create the table that is translated into a graph. The lesson gives instructions for the use...
Curated OER
In Debt or Not In Debt
Students investigate the use of credit cards. In this algebra instructional activity, students differentiate the interest rate of credit cards and how to stay debt free. They identify pros and cons of credit cards.
Curated OER
A Sweet Drink
Learners investigate reaction rates. In this seventh or eighth grade mathematics lesson plan, students collect, record, and analyze data regarding how the temperature of water affects the dissolving time of a sugar...
Virginia Department of Education
Factoring for Zeros
Relate factors to zeros and x-intercepts. Scholars first graph quadratics in both standard and factored forms to see that they are the same. They go on to use the graphs to see the relationship between factors and x-intercepts.
Noyce Foundation
Snail Pace
Slow and steady wins the race? In the assessment task, scholars calculate the rates at which different snails travel in order to find the fastest snail. Hopefully, your class will move much more quickly in finishing the task!
Curated OER
Box Plots
Young statisticians are introduced to box plots and quartiles. They use an activity and discussion with supplemental exercises to help them explore how data can be graphically represented.


