Curated OER
Negative Numbers on the Number Line Using the TI-83
In this negative numbers activity, students use the TI-83 calculator to compare the value of negative numbers. Students explain in short answer format how they used the calculator to determine their answers.
Curated OER
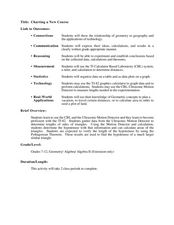
Charting a New Course
Students calculate the distance they will travel. In this geometry lesson, students use the TI and CBL system to make calculation of a certain path. They explore geography by calculating distances between different areas as it relates to...
Curated OER
Supersonic Dream
Students explore how fuel use affects the mass of different planes during flight and graph their results. They determine the per person fuel cost of a transatlantic flight for seven airplanes
Curated OER
What's Your Line?
Fifth graders collect temperature readings over a period of time, enter the information into a spreadsheet and choose the appropriate graph to display the results.
Curated OER
Finding Patterns and Graphing Functions
Pupils investigate patters for area and perimeter. In this Algebra I/Geometry lesson, students explore two different patterns as they write a formula for the nth term of each pattern. Pupils graph their results and determine if the...
Curated OER
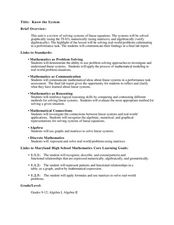
Know the System
Students identify the different systems of equations. In this algebra lesson, students solve systems of equations using graphing, elimination and substitution. They use the Ti to graph their systems.
Curated OER
Does Music Cam the Savage Beast?
Learners collect, graph and analyze data. In this statistics lesson, students measure the heart beat of a person as they listen to music. They use the CBL and TI to create a graph, analyzing the outcome.
Curated OER
Thanksgiving Dinner
Young scholars plan a traditional Thanksgiving dinner. In this Thanksgiving lesson, students compare and contrast the first Thanksgiving to Thanksgiving celebrations today. Young scholars plan a traditional Thanksgiving dinner and...
Curated OER
How High Are the Clouds?
Students analyze height and collect data to create a graph. For this statistics lesson, students use central tendencies to analyze their data and make predictions. They apply concept of statistics to other areas of academics to make a...
Curated OER
What Are We Listening To?
Learners gather data from a web site on number of music albums sold by genre for the last two years. They convert these figures to fractions, decimals, and percents, and display the results in bar graphs and pie charts.
Curated OER
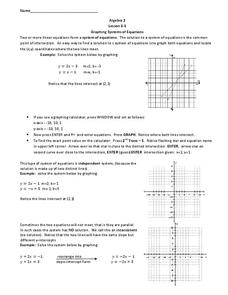
Graphing Systems of Equations
In this Algebra II learning exercise, 11th graders use graphing to determine the solution to a system of linear equations. The two page learning exercise contains explanation and three guided problems. Answers are not...
Curated OER
Confidence Levels
Learners collect data and graph it. In this statistics lesson plan, students rate confidence levels by collecting data and analyzing it. They graph their findings on the Ti calculator.
Curated OER
Transportation Math
Students explore the concept of exponents. In this exponents activity, students evaluate various bases to powers. The bases to a given power are in the context of miles driven, stops on a route, and minutes spent in...
Curated OER
Trigonometry Review
In this trigonometry worksheet, students solve trigonometric equations, prove trigonometric identities, and graph trigonometric functions. The four page worksheet contains sixteen questions. Answers are not...
Curated OER
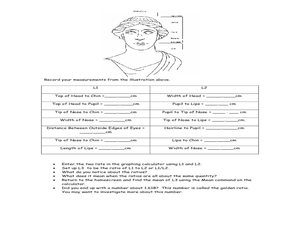
Hidden Ratios
In this ratios worksheet, students measure and record specified distances on a drawing of a head and shoulders. Students record information onto their graphing calculators and look for patterns in their information. They find the mean of...
Curated OER
Introductory Algebra Chapter 3 Review
In this math worksheet, students find the solutions to the problems while interpreting the line, bar, and circle graphs. The examples are given to help in the context of each objective.
Curated OER
Graphing Your Motion
Seventh graders investigate velocity and speed. In this Vernier Probe lesson, 7th graders will use probes to calculate motion, speed, and velocity of an object. They will create a graph of their collected data.
Curated OER
French Fry Run
Student explore estimation and measurement. In this measurement lesson plan, 2nd graders measure french fries, graph their data, and determine the size of french fries that is the best value. Students practice how to add prices and...
Curated OER
Graphing Trigonometric Functions
The student should be able to transfer his knowledge of graphing functions to graphing trigonometric functions. Student should be able to graph trigonometric functions, find amplitude, period, and frequency.
Curated OER
Using Inequalities to Problem Solve
Learners explore inequalities. For this Algebra I lesson, students solve and graph linear inequalities involving addition, subtraction, multiplication, or division. Learners use inequalities to solve and graph real-world problems.
Curated OER
The Closer I Get To You
Pupils explore the law of reflection. Through experimentation and problem solving, they collect and analyze data pertaining to reflection. The data is plotted on a graph and formulas for calculating the x and y values are evaluated.
Curated OER
Probability and Statistics
Students are taught to search the internet for statistics concepts on sports. In this probability lesson plan, students collect data and use the calculator to graph and analyze their data. They graph and make predictions about sports...
Curated OER
Marvelous Mathematics
Students make a table on the computer, but create fractions and equivalent fractions through the use of color. They are able to manipulate fractions in order to gain a greater understanding of the meaning of whole number that is broken...
Curated OER
And Now…the Supply Curve!
For this economics worksheet, students use their problem solving skills to respond to questions regarding the supply curve and its impact on an individual's lemonade stand business.


