Curated OER
How are Trig Ratios Used to Measure Triangle Sides
Students identify the ratios of trig identities. In this geometry lesson, students solve the missing sides and angles of triangles using trig ratios. They relate the graphs and waves to real life scenarios.
Curated OER
Set Theory Review Using the TI Navigator
Learners use technology tools and resources for managing and communicating personal/professional information. They select and apply technology tools for research, information analysis, problem solving, and decision making in content...
Curated OER
The Apple Orchard Problem
Students explore various approaches to solving a problem of maximizing the total production of apples in an orchard. In this apple orchard lesson plan, students collect data in order to solve the apple orchard problem presented. Students...
Curated OER
Exploration Sequence of Bounces
New skills are developed as students use graphing calculators and ranger technology to capture and graph the sequence of bounces a ball makes when dropped. After recording the height of four or more bounces, they use the collected data...
Curated OER
Standard Form of Equations
Learners complete the square and identify different parts of a quadratic equation. In this algebra lesson, pupils graph conics using the TI calculator. They rewrite equations by completing the square.
Curated OER
Zeros of Polynomials
High schoolers graph polynomials. In this Algebra II instructional activity, students investigate the graph of a polynomial to determine the value and the number of zeros. This instructional activity requires the use of a graphing...
Curated OER
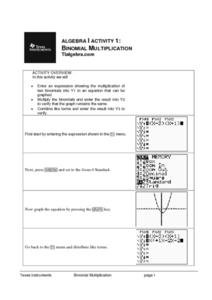
Binomial Multiplication
Learners explore binomial multiplication through the use of technology. Using a graphing calculator, you pupils enter the binomial expression into Y1, multiply the binomials and enter that result into Y2, and combine like terms and enter...
Curated OER
Make a Pass at Me
Students identify different types of functions and units of measurements. In this statistics lesson, students will collect data, graph their data and make predictions about their data. They plot a linear regression graph.
Curated OER
Integration
In this calculus instructional activity, 12th graders use integration to find the area under a graph. They use integration to solve real world problems. There are 4 different sections with their own problems.
Curated OER
Multiple Representations
Every topic or subject has its own special jargon. Learners work on their math vocabulary as it relates to basic algebra terms. They define and identify function, functional notation, ordered pairs, rate of change, slope,...
Curated OER
What's the Spin?
Learners use the CABRI application for their graphing calculator to rotate, translate, and reflect triangles. They use graphing calculators and follow detailed directions to manipulate triangles in specified ways. There are three...
Curated OER
Comparing Linear and Exponential Functions
Teach your class how to differentiate between linear and exponential functions. They use exponential properties to solve problems, graph them using the TI-Navigator, and make comparisons.
Curated OER
Betweenness and the Sum of Parts
High schoolers differentiate lines and angles using betweenness in this geometry instructional activity. They differentiate angles and lines using Cabri Jr. and analyze the data and make conjecture.
Curated OER
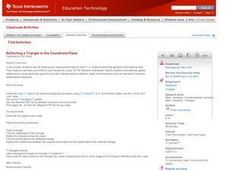
Reflecting a Triangle in the Coordinate Plane
Learners explore geometric concepts using technology. They manipulate the TI to find important math topics. This activity requires a TI-84 or higher.
Curated OER
Too Much Oxygen or Too Little?
In this oxygen worksheet, students analyze date about the oxygen levels in a river to determine the cause of the dying fish. This worksheet has 2 graphs, 12 short answer questions, and 2 graphic organizers.
Curated OER
Name That Tune: Matching Musical Tones Through Waveform Analysis
Pupils detect the waveform of musical notes to determine the code for the "safe" in this forensics simulation lesson. They use a microphone and tuning forks along with Vernier EasyData on their graphing calculator to analyze five musical...
Curated OER
Let's Gather Around the Circle
Scholars explore the relationship between circumference and diameter. Groups of learners measure the diameter and circumference of round objects and record their data on a given worksheet. They then input the data into their graphing...
Curated OER
What is my Angle? App
Learners estimate angle measures in this this estimating angle measures lesson. They use an application on their graphing calculator that shows various settings involving angles and then they estimate the angle measure of a clock's...
Curated OER
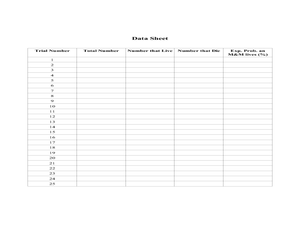
RIP M&M's
Learners solve theoretical probability problems. In this algebra lesson, students apply the concept of probabilities to solving real life scenarios. They collect data and graph it using experimental probability.
Curated OER
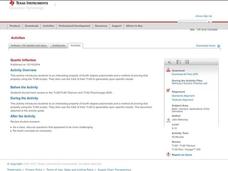
Quartic Inflection
Learners use their TI-89 calculator to find properties of the quartic polynomials. The lesson includes detailed instructions along with screen shots of the graphing calculator display.
Texas Instruments
Land Erosion - Running Off With Soil
Learners evaluate the relationship between rainfall and runoff of a small island for one year. For this rainfall vs. runoff lesson, students analyze the relationship between the rainfall and the runoff on Barro Colorado Island over a...
Curated OER
Angle Relationships
Tenth graders explore the angle relationships that exist when two lines intersect. For this geometry lesson, 10th graders estimate the measure of given angles and use their graphing calculator tools. Students use this knowledge to find...
Curated OER
Math TODAY for TI-Navigator System - Humidity Makes Air Feel Even Hotter ? Part II
Learners explore quadratic and cubic functions that will model the relationship between air temperature and heat index at fixed relative humidity values. They also make generalizations and apply the findings using their TI-83 Plus or...
Curated OER
Cabri Jr. Inscribed Angles
Young scholars construct inscribed angles using Cabri Jr. They draw a circle on their graphing calculator, then construct an inscribed angle and measure its angle measures. Learners drag the inscribed angle around the circle. They make...


