Curated OER
Pyramid Activity
Pupils explore the concept of pyramids. They determine if two sides of a pyramid are perpendicular using a graphing calculator, then discuss parallel and perpendicular lines and how to determine if two lines are parallel or...
Curated OER
Mathematical Analysis of Temperature Scales
Students use the point-slope formula to determine the relationship between the Celsius and Fahrenheit scales of temperature. They use a graphing calculator to determine the slope of the line between two points in each scale.
Alabama Learning Exchange
Explore the Transformations of Linear and Absolute Value Functions Using Graphing Utilities
Students explore the concept of transformations. For this transformation lesson, students use an applet that is an interactive absolute value graph applet. Students manipulate the applet to examine the change in the function...
Curated OER
Graphing Integers On a Coordinate Plane
Seventh graders explore the concept of graphing integers on a coordinate plane. In this graphing integers on a coordinate plane lesson, 7th graders discuss scenarios where coordinate systems are used in real life. Students represent...
Curated OER
Graphing Polar Coordinates
High schoolers engage in a lesson that is about the plotting of polar coordinates while graphing equations. They plot multiple points with the help of a graphing calculator and using coordinate graph paper. Students identify the pattern...
Curated OER
A New Phase In Town
Middle schoolers explore heat energy and how it is used to change the phase of matter, and discover that temperature does not increase or decrease until the phase change is complete. This extremely well-written plan is packed with great...
Curated OER
Regents High School Examination - Physics 2010
Give every type of learner in your physics class an opportunity to demonstrate what they have learned throughout the year. From analyzing tables and graphs, to evaluating diagrams and solving problems, there is an outstanding variety of...
Curated OER
Get a Half-Life Student Worksheet
Young scientists use a instructional activity to help them perform a lab on the decay of a radioactive element. The instructional activity serves as both a task guide and a lab sheet for pairs of learners. This activity requires a...
Utah Education Network (UEN)
Simplifying Exponential Expressions
This exponential expression resource has each of the class members determine the value of given exponential expressions. They use their calculator to find the values and identify patterns. Besides writing the numbers exponentially, they...
University of North Texas
Math Exam 1 Review
Perfect as a review guide, this worksheet provides a range of questions focusing on functions. Topics include composing functions, transformations, domains, and polynomials. Also included are corresponding worksheets focusing on other...
Curated OER
What Can I Afford?
Students explore the concept of cell phone plans. In this cell phone plan lesson, students research the cost of cell phones. Students compare various cell phone plans and decide on which phone plan is best for them.
Mathed Up!
Histograms
Class members explore how to read and use histograms by watching a video on creating and analyzing histograms. To finish, the class works on a set of questions that tests these skills.
MENSA Education & Research Foundation
Roller Coaster Mania!
Raise the energy level of your physical science class with this exciting hands-on activity. Applying their knowledge of kinetic and potential energy and Newton's laws of motion, young engineers use foam tubing and marbles to create...
Curated OER
Graph of the Tangent, cotangent, Secant, and Cosecant Functions
In this college level Pre-calculus worksheet, students examine the graphs of the Tangent, cotangent, secant, and cosecant functions. Students find the intercepts and any asymptotes. The seven page worksheet contains...
Curated OER
Graphing Data from the Chemistry Laboratory
Students graph and analyze data using a spreadsheet.
Curated OER
MOVING IN TWO DIMENSIONS (GRAPHING)
In this graphing worksheet, students are asked to graph a "sketch" of a path walked by a student. Directions E, W, N and S are used. Students are given 8 graphs to complete and are then asked to evaluate their findings.
Curated OER
Graphing Linear Equations
Students graph linear equations. In this algebra instructional activity, students investigate the price of tolls in different states and create a graph. They analyze their graph and draw conclusions.
Curated OER
C is for Cookie-A MEAN-ingful Graphing Activity
Third graders, in groups, dissect a variety of brands of chocolate chip cookies and calculate the mean for each brand. They create their own bar graphs, pictographs, and line graphs to represent information.
Curated OER
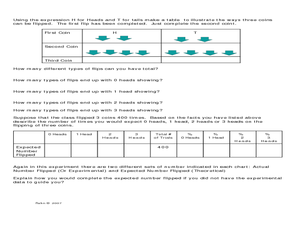
Let's Flip a Coin
In this probability instructional activity, students use a TI graphing calculator to simulate flipping a coin and compare their results (experimental probability) to the expected results (theoretical probability). The five page...
Curated OER
Square Roots, Number Classification, Ordering & Graphing
Ninth graders identify numbers as rational or irrational. Using calculators estimation, and factoring methods, 9th graders compute the square root of numbers. They graph numbers in sequential order and round numbers integers to the...
Curated OER
Let's Graph It
In this let's graph it activity, student interactively answer 10 multiple choice questions about graphing data and types of graphs, then click to check their answers.
Curated OER
Twenty-Eight Multiple Choice No Calculator AP Calculus AB Problems
For this AP Calculus AB practice exam worksheet, students solve twenty-eight various multiple choice calculus problems without using a calculator.
Curated OER
Twenty-Eight Multiple Choice No Calculator Allowed AP Calculus BC Practice Exam
In this AP Calculus BC practice exam, students solve twenty-eight multiple choice problems without the use of a calculator. This worksheet should be completed in fifty-five minutes.
Curated OER
Using a spreadsheet and the Internet to learn about stock market performance
Students record the progress weekly of a business of their choice on the stock market, graph those results, research and report on current news and how it pertains to the companies recent performance.


