Curated OER
I'm Warm Now
Third graders graph how much water is wasted while waiting for it to get warm in the spigot in the sink. In this graphing lesson plan, student first predict how much water is wasted. That night they test it out at home and the next day...
Curated OER
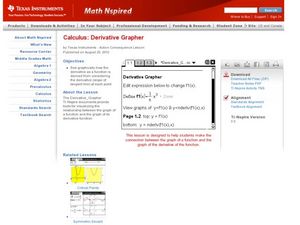
Derivative Grapher
Learners graph the derivative of functions in this calculus lesson. They use the TI to graph their functions and algebraically take the derivative of each function. They then create a visual and analyze the graph.
Curated OER
What Did It Cost 100 Years Ago?
Students compare prices of good across the century in order to introduce the topic of inflation. They undertand the concepts of inflation and Consumer Price Index (CPI), use online calculators to figure the approximate cost of goods...
Curated OER
Who's got the fastest legs?
Students use a stopwatch to collect information for a scatterplot. In this fastest legs lessons, students collect data through the taking of measurements, create and find a median number. Students develop an equation and...
Curated OER
Oodles of Poodles
Students solve equations by graphing. In this algebra lesson plan, students differentiate between functions and relations. They use the TI to graph their equation and analyze the graph.
Curated OER
Student - Designed Density Experiment and Poster
In this student-designed experiment worksheet, students decide on an experimental problem to solve. Students use the scientific method to perform an experiment and record the data. Students calculate the density of liquid used in the...
Curated OER
Simple Inequalities on a Number Line
Students solve inequalities problems. In this algebra instructional activity, students graph the solution of inequalities on a number line. They discuss boundaries and open or closed intervals.
Curated OER
Speed, Distance and Time
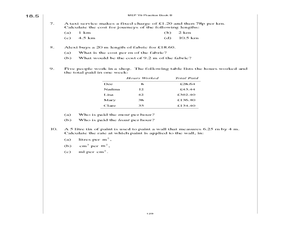
In these calculating speed, distance, and time worksheets, 6th graders review information, formulas, and examples, and solve word problems calculating average speeds, distance traveled, time taken, convert time measurements and speeds,...
Curated OER
What's Your Speed?
Learners explore the concept of distance v. time. They use a CBR to collect data on their distance over time, then plot their data using a scatter plot and find an equation to model their data. Pupils discuss what if scenarios which...
Curated OER
Domain and Range 2
How do you identify the domain and range of the function? As learners find out it's as easy as creating a graph. They'll identify the domain and range of a relation from its graph, write symbolic expressions describing the relationship...
Curated OER
Epsilon-Delta Window Challenge
Students graph functions and analyze them. In this calculus lesson, students define limit formally using Epsilon-Delta. They use the TI to graph the function and analyze it.
Curated OER
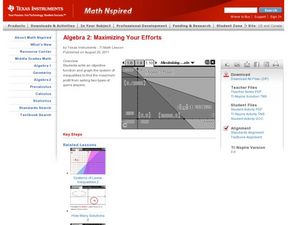
Maximizing Your Efforts
Students graph systems of equation. In this algebra lesson, students find where the lines cross and identify the type of solution. They analyze a graph and write the equation of the line.
Curated OER
Linear and Exponential Models
Students linearize data to determine if an exponential model is suitable. In this linearizing data to determine if an exponential model is suitable lesson plan, students graph the residuals of sets of data that appear to have an...
Curated OER
Leveled Problem Solving: Choosing and Analyzing Data Displays
In this using a bar graph to solve word problems learning exercise, students choose and analyze data to problem solve. Students solve six problems.
Curated OER
Where Will The Couch Fit?
Students name the area formula and describe how it works. They use area formula to calculate the surface area of various objects. They use the area formula to design a floor plan of an apartment.
Curated OER
Get Your Numbers in Shape - TI-83
High Schoolers use the TI-83 calculator to produce a sequence, explore patterns and find a linear or quadratic equation for a given pattern. They use inductive reasoning to make conjectures about patterns. They find the Y-value of a...
Curated OER
Analytic Geometry
In this analytic geometry worksheet, 9th graders graph and solve 13 different types of problems that include determining whether equations are linear to matching given equations to their corresponding equation in the second column....
Curated OER
Healthy Food Choices
Young scholars identify healthy food choices. In this nutrition lesson, students review the food pyramid and write down their favorite food on a post-it note. Young scholars create a bar graph of favorite foods using the post-it notes.
Curated OER
Solving Quadratic Equations
In this Algebra I/Algebra II activity, students solve quadratic equations by graphing and by taking the square root of both sides. The two page activity contains a combination five multiple choice and free response questions. ...
Curated OER
Technobiz
Students examine candy preferences to create a plan in order to improve candy sales. In this technobiz lesson, students build spreadsheet and organizational skills by graphing and calculating data. Students are introduced to terminology...
Curated OER
Diffusion
High schoolers design and carry out an experiment according to the scientific method. The experiment must test the effects of time and concentration on the rate of diffusion of potassium permanganate into potato cubes. After performing...
Curated OER
Wind
Students make a wind vane, anemometer, wind spiral, and wind streamer to calculate wind movement. In this wind lesson plan, students test each of their wind instruments, and graph the results of the wind speed in different locations.
Curated OER
Curve Sketching
In this calculus worksheet, students sketch a curve using a given function. They take the derivative of a function and graph it. There are 10 questions.
Curated OER
The Energy of Empty Space
In this energy in empty space instructional activity, students use an equation for Cosmic Inflation to solve eight problems. They find the domain and range of the function of the equation, they determinethe axis of symmetry, they find...


