Texas Instruments
Drawing a Line Tangent to a Circle
Explore lines tangent to a circle. In this math lesson, students manipulate circles and lines on a TI calculator. They draw a circle and analyze perpendicular lines intersecting the circle in only one place. This activity works...
EngageNY
The Slope of a Non-Vertical Line
This instructional activity introduces the idea of slope and defines it as a numerical measurement of the steepness of a line. Pupils then use the definition to compare lines, find positive and negative slopes, and notice their...
Illustrative Mathematics
Graphs of Quadratic Functions
Instead of the typical quadratic questioning, explore the function and look at the three different ways a parabola can be written. The main task is when given several clues, young mathematicians must write an equation that matches the...
EngageNY
Another Computational Model of Solving a Linear System
The process of elimination really works! Use elimination when substitution isn't doing the job. The 29th segment in a series of 33 introduces the elimination method to solving linear systems. Pupils work several exercises to grasp the...
Mathed Up!
Inequalities Regions
Discover how to solve systems of inequalities by graphing. An informative video shows pupils how to determine the solution set after graphing each inequality of a system. To finish, a worksheet gives them a chance to practice this skill.
Concord Consortium
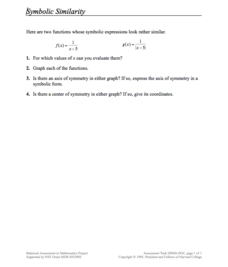
Symbolic Similarity
How many things does one transformation tell you? Learners compare and contrast the graphs of different parent functions with the same transformation. Using a rational and absolute value function, pupils identify key features of their...
Beyond Benign
Water Bottle Unit
How much plastic do manufacturers use to create water bottles each year? The class explores the number of water bottles used throughout the years to determine how many consumers will use in the future. Class members compare different...
Concord Consortium
Graphical Depictions
Parent functions and their combinations create unique graphical designs. Learners explore these relationships with a progressive approach. Beginning with linear equations and inequalities and progressing to more complex functions,...
Charleston School District
Pre-Test Unit 4: Linear Funcitons
Let your classes show you what they know! Use this pre-test to assess the current knowledge of your learners. The assessment includes all pre-algebra concepts related to functions: writing and graphing linear relationships, comparing...
Illustrative Mathematics
Puzzle Times
Give your mathematicians this set of data and have them create a dot plot, then find mean and median. They are asked to question the values of the mean and median and decide why they are not equal. Have learners write their answers or...
American Statistical Association
What Fits?
The bounce of a golf ball changes the result in golf, mini golf—and a great math activity. Scholars graph the height of golf ball bounces before finding a line of best fit. They analyze their own data and the results of others to better...
Kenan Fellows
Determining the Atomic Mass of Elements in a Compound Using Matrices
Scholars apply concepts learned in both Algebra II and Chemistry to answer the questions on the provided worksheet. The activity allows for extra practice in both classes and helps connect concepts usually taught in isolation. The...
Curated OER
Cost Calculations Lesson Plan
Students analyze data using graphs and equations. In this algebra activity, students calculate the cost of lumber, convert price per foot to price per piece, solve equations using addition and subtraction and give exact answer when...
Curated OER
Build A Skittles Graph
Students explore graphing. In this graphing lesson, students sort Skittles candies and use the color groups to create a bar graph. Rubrics and extension activities are provided.
Curated OER
Problem-Solving Application: Make a Circle Graph
In this circle graphs instructional activity, students analyze a data table about the activities in a day. Students then use this data to make a circle graph. Students answer 6 questions about the graph.
Curated OER
Watermelon Graphing
Young scholars discover bar graphs. In this primary math lesson plan, students identify the parts of watermelon seeds and other seeds. Young scholars learn the proper names and common names which refer to the parts of the seeds as they...
Curated OER
Circle Graphs
Fifth graders explore to find the central angle and percent. In this circle graph lesson, 5th graders use formulas to calculate the central angle and a protractor to create their graph. Students complete a graphing sheet for homework.
Curated OER
Making a Circle Graph of a Sample Budget
Students examine a sample budget and categorize the entries as a group. Then in small groups they convert budget category totals to percents and degrees to make a circle graph related to a sample budget.
Curated OER
Circle Graphs and Percents
For this circle graph and percentages worksheet, learners fill in a chart, write percentages, calculate discounts, and more. Students complete 4 sets of problems.
Oregon State
Using Paper Chromatography
Through the analysis of paper chromatography to separate ink from the pen found at the crime scene, learners analyze the different stains and through calculations determine the thief.
Curated OER
Statistical Analysis For Graphing Calculators
Students analyze date from the Chesapeake Bay. Using a graphing calculator, they enter the data, plot three temperatures, and create a Box and Whisker plot.
Curated OER
Using the Ti-83 Graphing Calculator
In this graphing calculator worksheet, students complete 11 operations on the calculator. Students enter absolute value, exponents, radicals, fractions, mixed numbers, etc.
PBS
The Yo-Yo Problem
What do yo-yos and pennies have to do with linear equations? Learn about writing and solving linear equations while considering the Yo-Yo Problem and Penny Pattern Exploration from the High School Math Project. Learners utilize algebra...
Mathed Up!
Transformation of Graphs
In what ways can you transform a graph? An engaging video answers this question as it covers reflections, translations, and stretches of graphs. To test their knowledge, individuals complete a set of problems to apply this knowledge.


