Curated OER
La Toteca- A Tropical Paradise
Students collect data on the time of the ferry. In this algebra lesson, students use the data to predict a ferry schedule. They also compute the depth where oxygen would be needed when diving.
Curated OER
Monitoring Oxygen Level
Students measure oxygen percentages in room air and air exhaled after they perform various activities. They explore various websites, and record and analyze the data from the experiments.
Curated OER
The Babylonian Algorithm, Limits and Rates of Change
In this successive approximations worksheet, students use the Babylonian algorithm to determine the roots of given numbers. They identify the limits of a function, and compute the rate of change in a linear function. This two-page...
Curated OER
Technology - Chaos Theory Lab
Ninth graders gain an understanding of Chaos Theory that exists in one's everyday environment.
Curated OER
High and Low Tides
Students collect real world data from the Web regarding high and low tides at various locations in the United States. They find a function which models this data and make predictions on tide levels based on the information found.
Curated OER
Modeling With Circular Functions
High schoolers explore circular functions. They identify the amplitude, period, phase shift and vertical shift of circular functions. Students analyze phenomena described by sine waves and they find mathematical models for transforming...
Curated OER
Jumping Rope-How Fit Am I?
Learners collect data over a 10-week period in their Physical Education class on how many jumps they can do in a minute period or another time period specified by the instructor.
Curated OER
To Drink or not to Drink
Seventh graders discuss water quality, water availability and water resources and how water is used in the world around them. They view a video on water quality then test for pH, temperature and dissolved oxygen to indicate water quality.
Texas Instruments
Texas Instruments: Algebra Ii and the Ti 83+
This session will examine how the TI-83+ can be used to improve instruction in Algebra II classes. We will look at different objectives from the Algebra II curriculum and examine several ways that calculators can improve student...
Texas Instruments
Texas Instruments: Graphing Polynomial Functions
Here's a very detailed, step-by-step activity for students to do to learn about the relationship between the factored form of a polynomial function and its graph. Calculator instructions for the TI-83 are given, right down to the screen...
Texas Instruments
Texas Instruments: Inequality Graphing App
This activity investigates the use of the Inequality Graphing App of the TI-83 Plus/TI-84 Plus to solve a linear programming problem.
Texas Instruments
Texas Instruments: Exploring the Vertex Form of the Quadratic Function
Examine the changes in a graph of a quadratic function that occur when different transformations are applied to the vertex form of the equation. Students will need to have the transformation graphing application on their TI-83+...
Texas Instruments
Texas Instruments: Points of Intersection and Zeros of Functions
Solve equations and find zeroes of functions using the TI-83 in this lesson. Keystroke instructions and calculator screenprints are included to help students with the activity.
Texas Instruments
Texas Instruments: Explore End Behavior
Guide your students to the discovery that the end behavior of a polynomial function is determined by the degree of the polynomial and the sign of the leading coefficient by using this activity from Holt, Rinehart, & Winston's Algebra...
Texas Instruments
Texas Instruments: Numb3 Rs Season 2 "Convergence" Where Is the Bullet?
Charlie uses parametric equations of projectile motion to figure out where to look for a fired bullet in the "Convergence" episode of the show NUMB3RS. The lesson plan includes a student page complete with keystroke instructions for the...
Texas Instruments
Texas Instruments: Inverse Functions
Review inverse functions with your students using this TI-83 activity. Students will find inverses of given functions, determine whether the inverse is a function, graph both, and check for symmetry through the line y=x. The lesson...
Texas Instruments
Texas Instruments: Numb3 Rs: Judgement Call: Filtering Suspects
This brief activity clarifies to use Bayes' Rule and conditional probability to narrow down searches. Students then have the opportunity to calculate some conditional probabilities using the same technique. Graphing calculator technology...
Texas Instruments
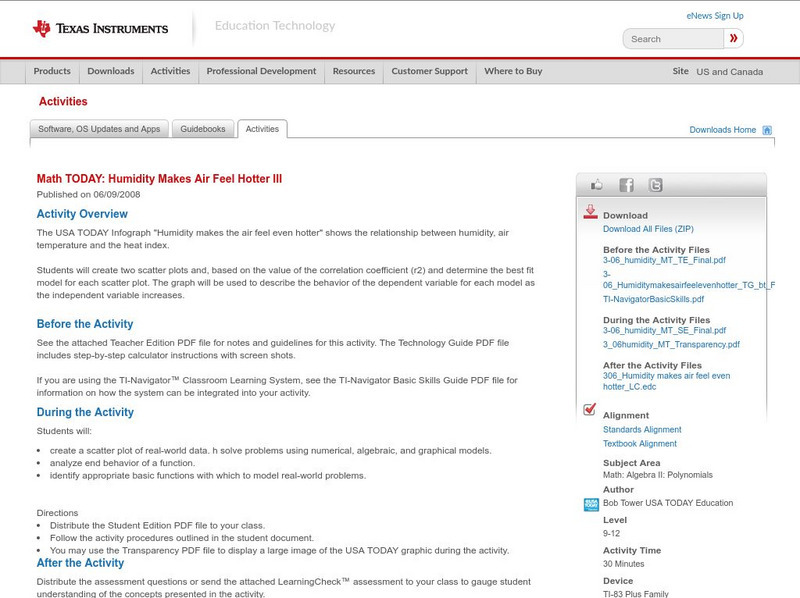
Texas Instruments: Math Today: Humidity Makes Air Feel Hotter Iii
Investigate the relationship among humidity, air temperature, and the heat index while learning about modeling data, evaluating functions, and describing the end behavior of a function. Students will use graphing calculator technology to...
Texas Instruments
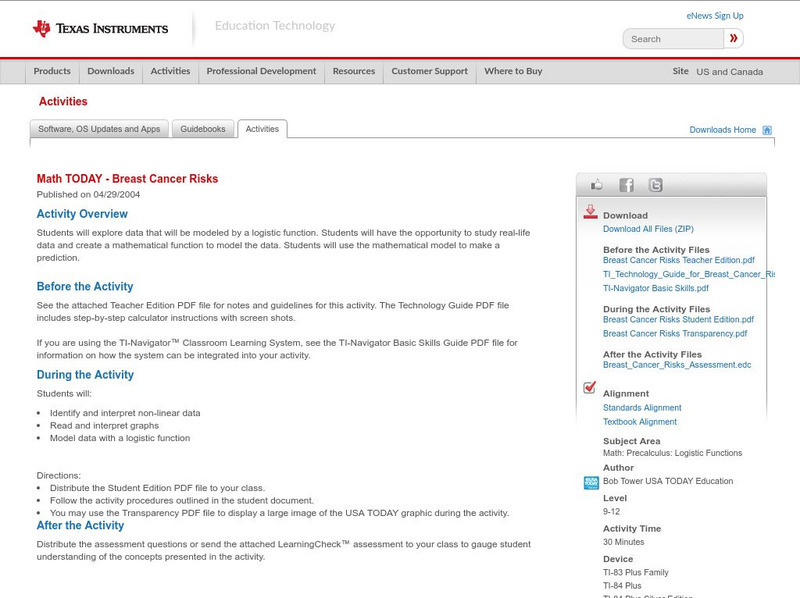
Texas Instruments: Math Today Breast Cancer Risks
Cross curricular lines while integrating technology into your classroom to study a real-world application of logistic regression. This activity shows students how to enter data into their graphing calculators and perform a regression in...
Texas Instruments
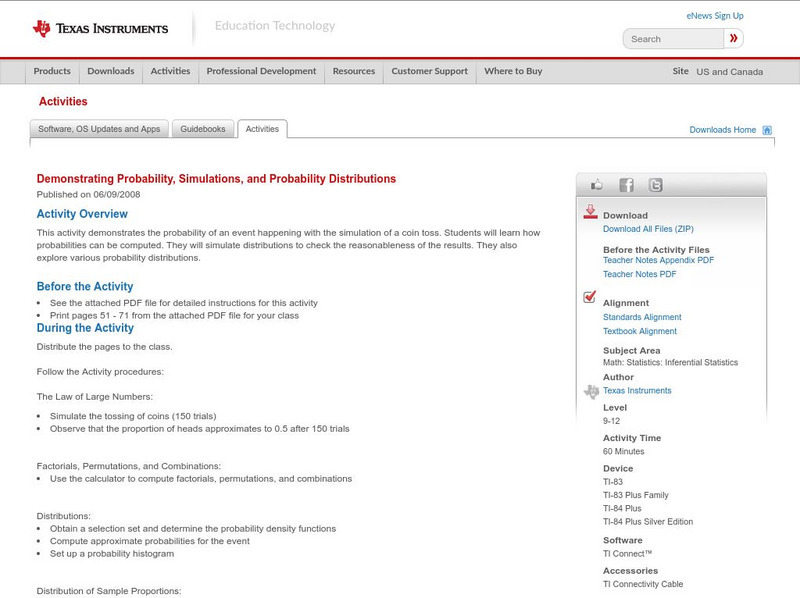
Texas Instruments: Probability, Simulations, and Probability Distributions
Use simulation on the TI-83 graphing calculator to teach students about the distribution of sample proportions, distribution of sample means, the Central Limit Theorem, normal probability plots, and the Law of Large Numbers. Pick and...
Texas Instruments
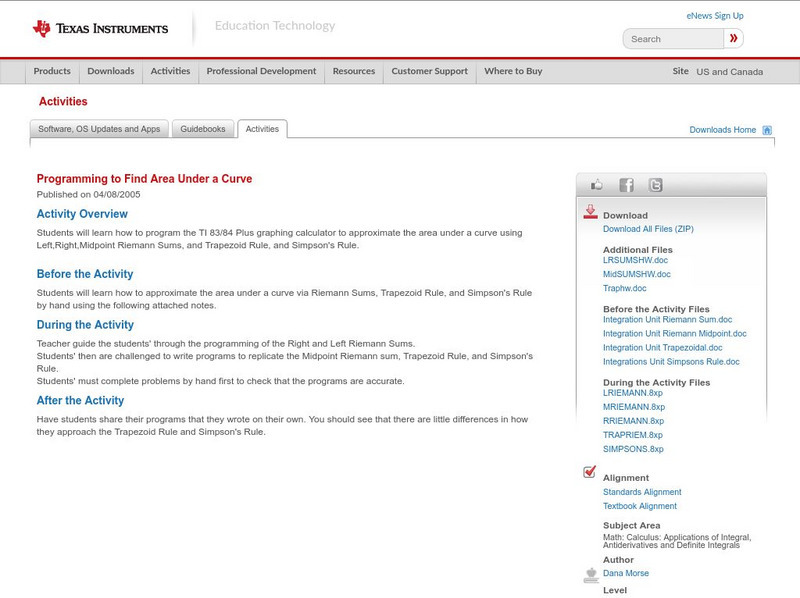
Texas Instruments: Programming to Find Area Under a Curve
Students will learn how to program the TI 83/84 Plus graphing calculator to approximate the area under a curve using Left,Right,Midpoint Riemann Sums, and Trapezoid Rule, and Simpson's Rule.
Texas Instruments
Texas Instruments: Modeling and Simulating Projectile Motion
This activity provides participants the opportunity to model and simulate projectile motion using a program and the TI-83/84 family of graphing calculators. It is a preliminary in-class activity used prior to actual launching an...
Other
Ostermiller.org: Between Curves Tools
This site provides instructions for programs you can put into a graphing calculator to find the area between curves.
Oswego City School District
Regents Exam Prep Center: Absolute Value Equations
The concept of absolute value equations is explained and then explored through several examples. Tips and suggestions are offered as to the common pitfalls to avoid. An all-class activity is also explained for the teacher to engage the...


