Curated OER
Quiz: Translations and Vectors
In this translation and vector activity, learners graph and label translations of polygons and points. Translation instructions are given as ordered pairs, as well as in written words. This one-page activity contains ten problems.
Curated OER
Tables and Relations
In this tables and relations worksheet, 9th graders solve and complete 13 various types of problems that include graphing. First, they solve each equation for the given variable. Then, students determine the ordered pairs that are...
Curated OER
Capture the Penguin
In this graphing activity, students play a game called Capture the Penguin where they put their penguins onto a graph with another player, roll dice to form ordered pairs, and start eliminating penguins. Students look at the scoring...
Curated OER
Algebra 2 - Linear Programming
Learners read real world problems, determine the variables, and set up the function using algebraic statements. After entering data into the graphing calculator, they display information in the form of graphs and scatter plots. ...
Curated OER
INTERPRETING MAGNETIC FIELD MAPS
Students interpret magnetic field maps, rotate the coordinates to obtain different views, change the coordinate representation, and produce alternate graphical representations.
Curated OER
The Distance Formula
In this distance formula worksheet, learners solve and complete 28 various types of problems. First, they find the distance between each pair of points provided. Then, students solve and graph the points.
Curated OER
Grids
In this geometry learning exercise, students plot and label 8 sets of points and triangles on a grid using coordinate pairs. They use both positive and negative numbers.
Curated OER
Vectors: Follow That Arrow
Vectors and their connection to motion. A video will be presented to provide information for the class to use methods of solving vectors with and without grids. Real-world physical concepts will be explored in reference to vectors.
Curated OER
What's Your Shoe Size? Linear Regression with MS Excel
Learners collect and analyze data. In this statistics activity, pupils create a liner model of their data and analyze it using central tendencies. They find the linear regression using a spreadsheet.
Curated OER
Data
Students collect data from an experiment they perform. For this data lesson, students use multiple representations to solve practical problems; describe advantages and disadvantages of the use of each representation. Then, they evaluate...
Utah Education Network (UEN)
Integers on a Coordinate Plane
Boogie fever! Explore the concept of integers on coordinate plane. In this integers on a coordinate plane lesson, learners graph rational numbers on the coordinate plane and identify coordinates of a point. Students perform a line dance...
Curated OER
College Prep Algebra, Worksheet Chapter 3, 2.5, 2.7, 3.1- 3.4
In this algebra worksheet, students translate 39 word problems into algebraic terms and solve them. They complete 42 problems about coordinate graphing, working with ordered pairs, slop, and equations of lines.. They make 2 scatter grams...
Curated OER
Systems of Equations 2
In this systems of equations activity, 9th graders solve and graph 9 different problems that apply the systems of equations. First, they solve each system of equations by using the graphing method. Then, students write the solution for...
Curated OER
Quadrants
In this quadrants instructional activity, 10th graders solve and graph 6 different graphs that contain four different quadrants. They name the quadrant or on which axis the point lies. Students identify the difference between graphing...
Curated OER
Equations and Inequalities
In this equations and inequalities worksheet, 9th graders solve and graph 8 different problems that include various systems of equations. First, they determine the solution to each set of system of equations. Then, students graph the...
Curated OER
Graphing Linear Equations
Students graph linear equations. In this algebra lesson plan, students solve linear equations and graph it on a coordinate plane. They evaluate integers using linear equations.
Curated OER
Direct Variation
In this direct variation activity, learners complete 9 multiple choice problems regarding direct variation. Students determine direct variation equations from word problems and from graphs.
West Contra Costa Unified School District
Matching Quadratic Functions
Ever sigh when learners ask why they have to know so many different forms of the quadratic equation? Here is a lesson that comes in handy! Using hands-on matching activities, quadratic equations are explored through...
Curated OER
Using Tables to Solve Linear Functions
Oh that intercept! Budding algebra masters solve linear equations from standard to intercept form. They identify the slope and y-intercept to help graph the lines, an then create coordinate pairs using a table of values. Great TI tips...
Curated OER
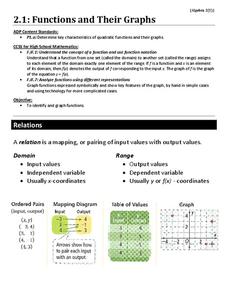
Functions and Their Graphs
Use a worksheet to go over the basic concepts of relations and functions. Included are clear definitions and examples of relations, domain and range, and functions and the vertical line test. However, the problems are pretty...
Curated OER
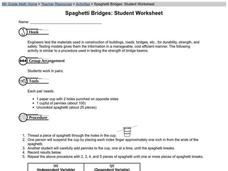
Spaghetti Bridges: Student Worksheet
Here is a wonderful activity that allows young engineers to try their hand at designing a bridge out of spaghetti! The worksheet explains the activity and also provides a graph for keeping track of the results. Very good!
Curated OER
Spaghetti Bridges: Student Worksheet
Pairs of learners work together in order to simulate how engineers test materials for strength and safety in the real world. They use paper cups and pieces of spaghetti to run strength tests. This excellent worksheet should lead to...
Curated OER
Bungee M&M's
Science is exciting - and delicious! Pairs of learners set up a bungee cord type of experiment. They use buckets filled with M & M's, a meter stick, and a Slinky spring (as the bungee) to conduct their experiment. A good activity...
Curated OER
Spaghetti Bridges: Student Worksheet
In this math worksheet, students will create a "bridge" out of spaghetti and test it's strength with pennies. Students will record their results on a table and then graph the results.


