Curated OER
Are You Coordinated?
First graders are introduced to a coordinate graph. They are given a graph and follow directions to place stickers in the designated blocks. They write coordinate points to identify the placement of their stickers.
Curated OER
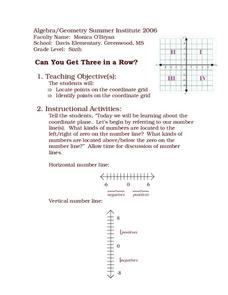
Three In a Row
Sixth graders examine how to locate coordinate points. For this coordinate graphing lesson, 6th graders locate the x and y axis. Students use their arms to show horizontal and vertical lines, participate in group and...
Curated OER
Battle Shapes
Fifth graders play Battleshapes which is a variation of Battleship with geometry. In this geometry lesson, 5th graders get a graph paper with four quadrants. They call out coordinate points and attempt to sink their opponents shapes.
Curated OER
Graphing Data
Students graph lines in a coordinate plane. In this geometry lesson, students graph lines on a coordinate plane, and identify the slope. They calculate the volume, area and perimeters of the shapes created on a coordinate plane.
Curated OER
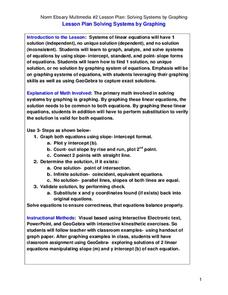
Solving Systems by Graphing
Students solve systems of equation through graphing. In this algebra lesson, students solve linear equations and analyze the result to figure out if there is one solution, no solution or infinitely many solutions. They graph their lines...
Curated OER
Solving a Pair of Linear Equations by Graphing
Teach your math lovers how to solve linear equations by graphing. Students identify pairs of coordinates and use it to graph a line and use the TI to graph and observe the line.
Curated OER
Data Collection and Graphing
Students collect data and graph it on a coordinate plane and analyze it. In this statistics instructional activity, students display their data collection using a graph. They determine which central tendency will work best.
Curated OER
Graphing Linear Equations Using the Table Method
Students graph linear equations using a table. In this algebra lesson plan, students create a table of values using the linear equation to find the y-values. They plot their point on a coordinate plane and graph the line.
Curated OER
Investigating Linear Equations Using Graphing Calculator
Students investigate linear equations using the Ti-Calculator. In this algebra lesson, students graph lines and identify the different quadrants on a coordinate plane. They identify ordered pairs used to plot lines.
Curated OER
More Graphing With Intercepts
In this graphing worksheet, students graph linear equations. They identify the x or y-intercept. Coordinate planes are available below each equation. Nine problems are provided on this two-page worksheet.
Curated OER
Walking the Plank: Student Worksheet
For this math worksheet, students will work in a group to experiment with the weight of objects when placed at a distance from a scale (using a plank). Students will record and graph their results.
Curated OER
More Graphing Situations by Making a Table
Learners calculate rate of change and graph linear functions. In this algebra lesson students write linear functions, make a table of points and graph their data on a coordinate plane. They calculate the rate of change of a graph.
Curated OER
Interpreting Graphs
Pupils investigate graphs. In this graphing lesson, students create a graph regarding the population of California. Pupils extrapolate answers concerning the data set.
Curated OER
Graphs of Quadratic Functions Section 11.6
In this graphing worksheet, students graph quadratic functions. They identify the maximum and minimum value of the function, determine the line of symmetry, and locate the vertex. Coordinate planes are provided for each function. There...
Curated OER
Graphing Linear Equations with Calculator
Students graph lines using the calculator. In this algebra lesson, students graph lines of equations in the form y=mx+b. They input equations into the TI Calculator and graph using the slope and intercept. They analyze the graph for...
Curated OER
Graphs
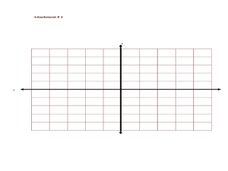
In this graph template worksheet, young scholars use the ten by ten coordinate grid to solve problems. Students observe 1 graph.
Curated OER
What's Up With My Class
Middle schoolers collect data about their class and they use Excel spreadsheet to display their tables and graphs about the class. They answer survey questions and collect their data. Students create a graph of their choice to display...
Curated OER
MP3 Purchase Plans
Use algebra to solve real world problems. Mathematicians practice use of graphs, tables, and linear functions to solve a problem regarding mp3 purchase plans. They work in groups to solve the problem and present their findings and...
EngageNY
Four Interesting Transformations of Functions (Part 1)
Understanding how functions transform is a key concept in mathematics. This introductory lesson makes a strong connection between the function, table, and graph when exploring transformations. While the resource uses absolute value...
EngageNY
Structure in Graphs of Polynomial Functions
Don't allow those polynomial functions to misbehave! Understand the end behavior of a polynomial function based on the degree and leading coefficient. Learners examine the patterns of even and odd degree polynomials and apply them to...
Curated OER
Usage and Interpretation of Graphs
Students review graphing and use processing skills to solve problems.
Curated OER
Graphing Linear Equations with Two Variables
Can your class solve linear equations in two variables? They will be able to after they engage in this lesson plan. Individuals graph linear equations in two variables using slope and intercept and identifying the relationship between...
Curated OER
Graphing Quadratic Equations with a Coefficient of One
This is a teacher page for a lesson and does not include any materials to support the lesson. Students graph quadratic equations with a coefficient of one and create a table of values to graph a quadratic equation. They plot the values...
Curated OER
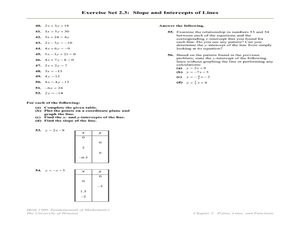
Slope, Intercepts, and Graphing a Line
In this intercepts and slope worksheet, students find the slope and/or the x and y-intercepts in fifty-three problems. Students also graph lines using the x and y-intercepts.


