Curated OER
Grab the Candy Hearts
For this candy activity, learners play the game Grab the Candy for Valentine's Day where they roll dice to find ordered pairs on a graph and place the candy inside that square. Students play until all candy is gone and use the scoring...
Curated OER
Gridlock Jr.
In this gridlock worksheet, students roll dice and put counters in the ordered pairs on the graph that they get from the rolled dice. Students play this game and whoever gets 3 in a row wins.
Curated OER
Geometric Coordinates
In this geometric coordinates worksheet, students solve and complete 3 different types of problems. First, they use the equations provided to complete the table on the right. Then, students plot the x- and y- coordinates on the graph to...
Curated OER
Properties of Parabolas
In this properties of parabolas worksheet, students identify the vertex and the minimum and maximum value of each parabola. They graph parabolas on a coordinate plane. This four-page worksheet contains 14 problems. Answers are provided...
Curated OER
Inequalities in Two Variables
In this inequality worksheet, students solve inequalities with two-variables. They solve systems of equations. Students graph inequality problems on a coordinate plane. This four-page worksheet contains 36 problems.
Curated OER
Plotting Coordinates on a Grid
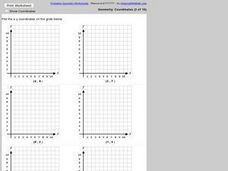
For this plotting points on a graph worksheet, middle schoolers plot 6 points on 6 graphs. Students plot x and y-coordinates in the first quadrant.
Curated OER
Graphing Linear Equations
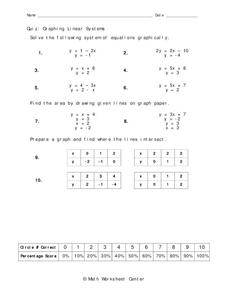
In this graphing worksheet, students solve systems of linear equations by graphing on a coordinate plane. Given specific coordinates, students determine the line of intersection. This one-page worksheet contains ten problems.
Curated OER
Chapter 3 Review
In this review worksheet, students read circle graphs and line graphs. They identify quadrants in a coordinate plane and match graphs to their appropriate linear equation. Students find the slope of a line and identify the y-intercept....
Curated OER
Solving Systems of Equations by Graphing
In this systems of linear equations worksheet, students graph two equations on each coordinate grid. All systems are linear. One of the systems is parallel. The others have one point of intersection.
Curated OER
Translating Graphs of Trig Functions
Students use degrees and compute the amplitude and period of twelve functions. They graph each function on an included coordinate grid.
Curated OER
Graphing Linear Equations
For this math worksheet, students practice graphing the linear equations on the Cartesian plane. They also create a function table for each.
EngageNY
Perimeter and Area of Polygonal Regions Defined by Systems of Inequalities
When algebra and geometry get together, good things happen! Given a system of inequalities that create a quadrilateral, learners graph and find vertices. They then use the vertices and Green's Theorem to find the area and perimeter of...
EngageNY
Lines That Pass Through Regions
Good things happen when algebra and geometry get together! Continue the exploration of coordinate geometry in the third lesson in the series. Pupils explore linear equations and describe the points of intersection with a given polygon as...
Achieve
Rabbit Food
Keep your pets slim, trim, and healthy using mathematics! Pupils use a linear programming model to optimize the amount and type of food to provide to a pet rabbit. They model constraints by graphing inequalities and use them to analyze a...
EngageNY
Geometric Interpretations of the Solutions of a Linear System
An intersection is more than just the point where lines intersect; explain this and the meaning of the intersection to your class. The 26th segment in a 33-part series uses graphing to solve systems of equations. Pupils graph linear...
EngageNY
Dividing Segments Proportionately
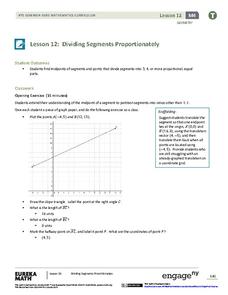
Fractions, ratios, and proportions: what do they have to do with segments? Scholars discover the midpoint formula through coordinate geometry. Next, they expand on the formula to apply it to dividing the segment into different ratios and...
EngageNY
An Appearance of Complex Numbers 2
Help the class visualize operations with complex numbers with a lesson that formally introduces complex numbers and reviews the visualization of complex numbers on the complex plane. The fifth installment of a 32-part series reviews the...
EngageNY
There is Only One Line Passing Through a Given Point with a Given Slope
Prove that an equation in slope-intercept form names only one line. At the beginning, the teacher leads the class through a proof that there is only one line passing through a given point with a given slope using contradiction. The 19th...
Willow Tree
Systems of Equations
Now that learners figured out how to solve for one variable, why not add another? The lesson demonstrates, through examples, how to solve a linear system using graphing, substitution, and elimination.
Charleston School District
Review Unit 4: Linear Functions
It's time to show what they know! An assessment review concludes a five-part series about linear functions. It covers all concepts featured throughout the unit, including linear equations, graphs, tables, and problem solving.
MARS, Shell Center, University of Nottingham
Defining Regions Using Inequalities
Your young graphers will collaboratively play their way to a better understanding of the solution set produced by the combining of inequalities. Cooperation and communication are emphasized by the teacher asking questions to guide the...
Curated OER
Parametrics 1
In this parametric worksheet, students sketch given inequalities and use trigonometry functions to eliminate the parameters. They write equations of a line under given parameters. This four-page worksheet contains 11 multi-step problems.
Curated OER
Slopes of Lines
In this slopes of lines instructional activity, 10th graders solve and graph 10 different problems. First, they determine the slope of each line named in the figure and any line parallel to line b and perpendicular to line d. Then,...
Curated OER
Locate Points on a Grid: Practice
In this ordered pairs learning exercise, students use the graph and write the letter of the point for each ordered pair. Students then write the ordered pair for the given points. Students then answer the six grid location questions.


