Curated OER
What Is Your Point?
Sixth graders identify the x and y axes in a coordinate plane and identifies the coordinates of a given point in the first quadrant. They plot specific points in the first quadrant of the Cartesian coordinate system.
Curated OER
Rocketsmania And Slope
Students use a professional basketball team's data and graph it on a coordinate plane. They draw a line of regression and finding its equation. They access a website containing statistics for the Houston Rockets basketball team to solve...
Curated OER
Slope and Parallel Lines
Students plot pairs of Cartesian coordinates on graph paper and connect points with straightedges. They examine the lines and determine if they are parallel or not by finding the equations of the lines and comparing the slopes. They...
Curated OER
Slope-Intercept Form of a Line
Using the subscriber website Explorelearning.com, young mathematicians observe changes in the slope and y-intercept and their effect on the graph of lines. This activity helps students develop an intuitive sense of the connection between...
Illustrative Mathematics
Coffee by the Pound
This is a great exercise in graphing proportional quantities to interpret the unit rate as the slope of a graph. It is not easy for learners to understand what a unit rate is. When it is presented as the slope of a linear line graph,...
Alabama Learning Exchange
Bloodstain Pattern Doesn't Lie......
An interesting instructional activity on hypothesizing about the diameter of a drop of blood that is splattered. To test their theories, learners work in groups to make blood droplets splatter from different heights. They use graphed...
Curated OER
Hit Me If You Can!
Students graph linear equations using slopes and intercepts. In this algebra lesson plan, students identify the slope as being positive,negative or undefined. They differentiate between different quadrants on a coordinate plane.
Curated OER
Building a Rover
Middle schoolers investigate properties of lines and points by making a rover. In this algebra lesson, students plot points correctly on a coordinate plane. They identify coordinate pairs given the plots and lines.
Curated OER
Carbon Monoxide and Population Density
Tenth graders investigate the carbon monoxide level at a fixed latitude. They determine if there is a relationship to population density. They download data sets and generate a graph. They determine a link between human activity and...
Curated OER
The Treasure Map
Third graders problem solve using drawings and map interpretations. They preview graphs and Cartesian geometry. They follow directions on a map using a grid and compass references while simulating they are reading a pirate map.
Curated OER
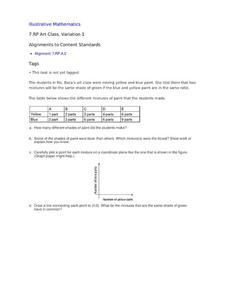
Art Class, Variation 1
Student statisticians calculate ratios to determine how many shades of green were mixed by Ms. Baca's art class. They graph the number of blue parts against the number of yellow parts for each combination and discover that some produce...
EngageNY
Ferris Wheels—Tracking the Height of a Passenger Car
Watch your pupils go round and round as they explore periodic behavior. Learners graph the height of a Ferris wheel over time. They repeat the process with Ferris wheels of different diameters.
Teach Engineering
Can You Resist This?
Some things are hard to resist. Small collaborative groups build circuits and calculate the voltage using Ohm's Law. Budding engineers explore the connection between the voltage across different resistors and linear...
Curated OER
Rotations in the Plane
Pupils investigate the properties of a rotation as they use technology (Cabri, Jr.) to observe the relationship between the pre-image and the image formed by the rotation. The instructional activity provides ample opportunity for...
Curated OER
Solutions, Solutions, Could it Be?
Students graph and solve linear system of equations. In this algebra lesson, students use algebraic and graphing methods to solve their systems. They find the point of intersection for their solution and draw inference from their data.
Curated OER
Reflections
Students investigate image and pre-image. In this geometry lesson, students identify the reflection and rotation of different shape on a coordinate plane. They identify similarities and differences of image and pre-image of a reflection.
Curated OER
Writing Linear Equations in Slope-Intercept Form
In this math worksheet, students are given three lines graphed on a coordinate grid. Students identify the slope, intercepts, and write an equation for each. Students find the intercepts of a linear equation, and graph them. They write...
Curated OER
Decode Word Is..
Students solve problems using patterns. In this algebra lesson plan, students identify the relation, domain and range of a function. They graph functions using coordinate pairs.
Curated OER
Finding the Area of a Parallelogram with Translations
Students calculate the area of a parallelogram. In this geometry lesson, students perform translation using a coordinate plane and coordinate pairs. They perform translation on other polygons.
Curated OER
How Much Will I Spend On Gas?
Students construct a linear graph. In this graphing lesson plan, students determine a monthly budget for gasoline. Students construct a t-chart and coordinate graph to display data. Resources are provided.
Curated OER
Linear Functions-Learn Your Lines
Students solve and graph linear equations. In this algebra lesson, students collect and plot data on a coordinate plane. They use the CBL and TI calculator to graph systems of equation.
Curated OER
Transformations and Translation of Functions
Students translate functions horizontally and vertically. In this algebra lesson, students identify the parts of the formula that allows the graph to move left, right, up and down. They perform a transformation on the coordinate plane.
Curated OER
Polling and Statistics
Students investigate polling. In this statistics lesson, students collect data-on polling and graph their data on a coordinate plane. They identify biased and non-biased polling.
Curated OER
Linear Functions, Restricted Domains, Infinite Geometric Series, Interconnections
In this math worksheet, students graph the linear functions in comparison to the inequalities. Then they compare the line segments on the coordinate plane.


