Curated OER
Science: Hurricanes As Heat Engines
Pupils conduct Internet research to track the path of Hurricane Rita. They record the sea surface temperature of the Gulf of Mexico during and after the hurricane and draw conclusions about how hurricanes extract heat energy from the...
EngageNY
Finding Systems of Inequalities That Describe Triangular and Rectangular Regions
How do you build a polygon from an inequality? An engaging lesson challenges pupils to do just that. Building from the previous lesson in this series, learners write systems of inequalities to model rectangles, triangles, and even...
West Contra Costa Unified School District
Sneaking Up on Slope
Pupils determine the pattern in collinear points in order to determine the next point in a sequence. Using the definition of slope, they practice using the slope formula, and finish the activity with three different ways to...
Curated OER
Inquiry Unit: Modeling Maximums and Minimums
Young mathematicians explore the maximun area for patio with the added complexity of finding the mimimum cost for construction. First, they maximize the area of a yard given a limited amount of fence and plot width v. area on a...
EngageNY
The Computation of the Slope of a Non-Vertical Line
Determine the slope when the unit rate is difficult to see. The 17th part of a 33-part series presents a situation that calls for a method to calculate the slope for any two points. It provides examples when the slope is hard to...
EngageNY
Secant and the Co-Functions
Turn your class upside down as they explore the reciprocal functions. Scholars use the unit circle to develop the definition of the secant and cosecant functions. They analyze the domain, range, and end behavior of each function.
Curated OER
Place Value and Transformation
Fourth graders have a class discussion about fraction and negative numbers that were in the coordinates. They plot and read ordered numbered pairs. They transform ordered pairs and explore transformation of figures on a plane.
Curated OER
Hyperbolas
Learners engage in a lesson that covers the concepts related to the graphing of hyperbolas looking at topics like foci, center, vertices, and asymptotes. They find multiple different points in the coordinate plain and then plot the graph.
Curated OER
Worksheet 23 - Directional Derivative
In this function worksheet, students compute the directional derivative of a function and identify the xy-coordinates of the maximum and local minimum. This two page worksheet contains six multi-step problems.
Curated OER
Transformations
Tenth graders recognize, perform and derive rules for basic transformations including translation, reflection and rotation. They also consider compositions, a combination of two or more basic transformations. Students explore both...
Curated OER
High School Mathematics Problems from Alaska: Stanley Jonas Travel Problem
Students convert from one system of linear measure to another, graphing data from a table to a coordinate graph, using a graph to make predictions.
Curated OER
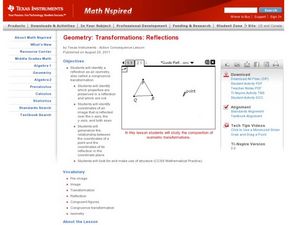
Transformations: Reflections
Students perform transformations on their graphs. In this algebra lesson, students identify the pre-image and image. They find and identify congruent shapes and isometry.
Curated OER
Slopes and Linear Equations
Students find the slopes of linear functions. In this graphing lesson, students analyze linear equations and calculate the slope of the line. They graph a line given the slope and y-intercept.
Curated OER
Slope
Students calculate the slope of a line. In this slope lesson plan, students use a graph, an equation or two points to help them calculate the slope of a line. They differentiate between a slope of zero and an undefined slope.
Curated OER
Exploring Transformations: Translations and Reflections
Learners perform translation and reflection. They identify the coordinate points of the new graph and create a formula for the movement. They identify the pre-image the and after image.
Curated OER
How Many Solutions 2
High schoolers solve systems of equations. In this algebra lesson, students graph lines and identify the point of intersection. They identify the function to see if it is a function.
Curated OER
Slopes and Slope Intercepts
Students identify the slope of an equation using various methods. In this algebra lesson, students graph linear equations and calculate the slopes using the x and y intercept to solve the equations and graph the lines. They use the slope...
Curated OER
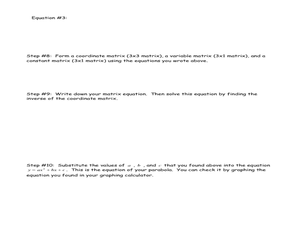
Quadratic Equations and Parabolas
Students graph and solve quadratic equations. In this functions lesson, students analyze a quadratic equation using three points on a curve to define the graph of a quadratic function. They find the vertex and intercepts of the graph.
Curated OER
Transformations and Exponential Functions
Tenth graders study graphing exponential functions. In this transformations lesson, 10th graders apply inquiry to determine how changes to a parent function affect its graph. Students analyze transformed graphs and generate the function...
Curated OER
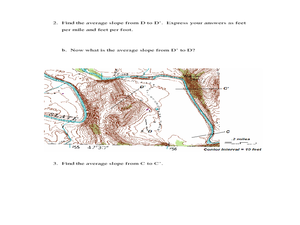
Slope and Topographic Maps
Learners investigate slopes as they study topographic maps. In this algebra lesson, students discuss and apply the concept of slopes to graphing and analyzing data.
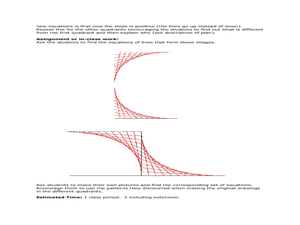
Curated OER
Mathematics of Doodles
Students use the slope and y-intercept to graph lines. In this algebra lesson plan, students graph linear equations and apply it to solving real life problems.
Curated OER
Walking Home II
Students explore the relationship between distance and time. They analyze a situation involving distance traveled in a given period of time, represent the situation graphically and algebraically, and discuss the concept of slope as a...
Curated OER
Solving Using Linear Equations
Seventh graders explore linear equations. They observe the relationship between linear equations an patterns. Students make decisions using information given in graphs to solve linear equations. They perform a toothpick activity to...
Curated OER
Sign of the Derivative
Learn how to investigate the change in a graph by dragging the cursor to observe the change in the function. They use the TI calculator to graph their parabola.


