Inside Mathematics
Graphs (2006)
When told to describe a line, do your pupils list its color, length, and which side is high or low? Use a worksheet that engages scholars to properly label line graphs. It then requests two applied reasoning answers.
CK-12 Foundation
Bar Graphs, Frequency Tables, and Histograms: Comparing Heights
Become a master at creating visual displays. Using a provided list of heights, users of the interactive create a bar graph and a histogram. They answer a set of challenge questions based on these data representations.
College Board
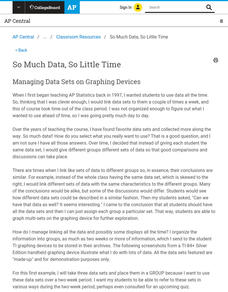
So Much Data, So Little Time
Organizing data in a statistics class is often a challenge. A veteran statistics teacher shares data organization tips in a lesson resource. The instructor shows how to group data to link to individual calculators in a more efficient...
Curated OER
Piecewise Linear Functions: Extending Stories to Graphs
Using this resource, scholars develop graphs that model situations by showing change over time. They answer 15 questions based on information from charts that show growth in weight. They extend the concepts to an assessment section of...
Curated OER
Simple Tally Charts and Bar Graphs
Introduce your first graders to the world of tally marks, bar graphs, and the organization of data. Pupils determine a favorite ice cream flavor based on tally marks, then use a bar graph to answer some questions about sports. There are...
Howard Hughes Medical Institute
Gorongosa: Scientific Inquiry and Data Analysis
How does the scientific process begin? Introduce ecology scholars to scientific inquiry through an insightful, data-driven lesson. Partners examine data from an ongoing research study to determine the questions it answers. The resource...
Earth Watch Institute
Entering Local Groundhog Data in an Excel Spreadsheet
Here is a cross-curricular ecology and technology instructional activity; your learners create spreadsheets depicting the location and number of groundhog dens in a local park. They research groundhogs and analyze data about where the...
Centre for Innovation in Mathematics Teaching
Ten Data Analysis Activities
This thirteen page data analysis worksheet contains a number of interesting problems regarding statistics. The activities cover the concepts of average measurements, standard deviation, box and whisker plots, quartiles, frequency...
Chicago Botanic Garden
Historical Climate Cycles
What better way to make predictions about future weather and climate patterns than with actual climate data from the past? Young climatologists analyze data from 400,000 to 10,000 years ago to determine if climate has changed over time....
Curated OER
Organizing Data
In this organizing data worksheet, 7th graders solve seven different types of problems related to data. They first identify the type of data as categorical, discrete or continuous from the information given. Then, students use Excel to...
Curated OER
Interpreting Data and Statistics using Graphs
Seventh graders interpret data. In this lesson on types of graphs, 7th graders construct, interpret, and analyze different graphs. This lesson includes worksheets and resources.
Curated OER
All About Graphs
Students practice organizing data by creating graphs. In this statistics lesson, students survey the class about favorite colors and create a bar graph using the data. Students complete a test based on pet and animal statistics.
Curated OER
Birthday Graph
Students explore graphs. In this graphing math lesson, students record the birthdays of each classmate on a data table. Students cut out and add a picture of a birthday cake to a floor or wall pictograph representing the month in which...
Curated OER
Interpreting Line Graphs
Fifth graders interpret line graphs. In this graphing lesson, 5th graders first begin by reviewing the difference in bar and line graphs and what they are used for. Students practice interpreting the data on various line graphs and using...
Curated OER
Problem-Solving Application: Make a Circle Graph
In this circle graphs worksheet, students analyze a data table about the activities in a day. Students then use this data to make a circle graph. Students answer 6 questions about the graph.
Curated OER
Veggie Chop and Data Analysis
First graders chop vegetables into fractions. In this fractions lesson, 1st graders cut vegetables, collect data about favorite vegetables and create a bar graph using the information. Students make inferences about the data and record...
Curated OER
Tally and Graph
In this survey and graphing worksheet, students take a survey of 10 friends by asking them to vote for their favorite musical instrument. They fill in a tally chart, track the tally marks, and develop a bar graph with the information.
Curated OER
Make a Graph
In this graphing learning exercise, 1st graders use given data to create a graph and answer questions. In this problem solving learning exercise, students solve five problems.
Curated OER
Statistics for Graphing
Students use the Internet to access a variety of websites that present statistics and information for use in graphing. They represent sports statistics, geographical measurements, temperatures and more.
Curated OER
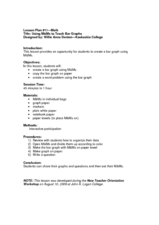
Using M&M's to Teach Bar Graphs
Motivate your class with this lesson. While not fully fleshed out, this activity is meant to be used as an introduction to the use of bar graphs. Learners sort M&M's and create bar graphs to display their information.
Curated OER
Graphing Information from a Data Table
In this graphing worksheet, students solve 12 problems in which data on a table is presented on a bar graph. This page is intended to be an online activity, but may be completed with paper and pencil.
Curated OER
Shapes Graphing
In this graphing data worksheet, students examine the 11 shapes pictured and use that information to finish an incomplete bar graph.
National Security Agency
Going Green with Graphs
For this unit designed for second graders, youngsters are introduced to conducting surveys and creating tally charts based on the data they gather. Students then construct bar graphs, and observe the relationships between the two types...
National Security Agency
Line Plots: Frogs in Flight
Have a hopping good time teaching your class how to collect and graph data with this fun activity-based lesson series. Using the provided data taken from a frog jumping contest, children first work together creating a line plot of the...
Other popular searches
- Data Analysis Graphing
- Graphing and Analyzing Data
- Data and Graphing
- Graphing Data Project
- Collecting and Graphing Data
- Graphing Data in Science
- Collecting Data Graphing
- Organizing and Graphing Data
- Mathematics Graphing Data
- Data Tables and Graphing
- Line Graphing Data
- Graphing Data in Astronomy


