Teach Engineering
Understanding the Air through Data Analysis
Is there a correlation or causation relationship between air pollutants? Groups develop a hypothesis about the daily variation of air pollutants, specifically ozone and CO2. Using Excel to analyze the data, the groups evaluate their...
Rainforest Alliance
Forests of Guatemala
With 90 percent of its land area covered in forests, Suriname, a country in South America, contains the largest percentage of forests throughout the world. Here is an activity that brings classmates together to learn about the...
Mascil Project
Epidemics: Modelling with Mathematics
The Black Death epidemic is responsible for more than one million deaths in the United Kingdom. An inquiry-based activity has young scholars explore the rate of disease spread. They then analyze graphs showing data from epidemics such as...
Chemistry Collective
Virtual Lab: Unknown Acid and Base Problem
Looking for an easy way to give your class experience with acid-base chemistry outside the lab? Try a detailed interactive that puts them in total control! Young chemists determine the dissociation constant and concentration of an...
Kenan Fellows
Designing and Analyzing Data Collected from Wearable Devices to Solve Problems in Health Care
Wearable devices have become more the norm than the exception. Learners analyze data from a sample device with a regression analysis in a helpful hands-on lesson. Their focus is to determine if there is a connection between temperature...
NOAA
Understanding El Niño Using Data in the Classroom
Are weather troubles caused by El Nino? An installment of a larger series presents a five-part lesson on El Nino. First, scholars learn to read sea surface temperature maps. Then, they compare them to data on graphs before determining if...
Space Awareness
Star in a Box
What happens to stars as they get older? A simulation takes pupils through the life cycle of stars based on their masses. The resource introduces the Hertzsprung-Russell diagram and the common relationships and life cycle patterns observed.
STEM for Teachers
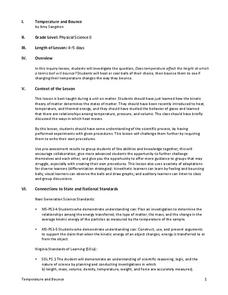
Temperature and Bounce
Take part in a fun experiment and hold an impromptu bouncing contest with your class. Young scientists heat and cool balls before bouncing them to determine whether temperature changes affect how they bounce. The set of STEM lesson plans...
Virginia Department of Education
Charles’ Law
Searching for a relatively interesting way to demonstrate Charles' Law? Here is a instructional activity in which pupils heat air inside a flask and then cool the flask to quickly cool the air. They make observations about what occurs...
Virginia Department of Education
Prokaryotes
Lead your biology class on a cell-sized adventure! Emerging scientists construct models of prokaryotes, then design an experiment to properly grow a bacterial culture. They conclude the activity by viewing the culture under a microscope....
Curated OER
Olympic Bar Graphs
For this Olympic bar graph worksheet, students pick a sport from the 2004 Olympic games and find data from the Olympic web page. They graph the scores (times, distance, or speed) and the medals. They answer questions about the variables...
Curated OER
Graphing Your Motion with Vernier LabQuests
Seventh graders create motion graphs using a motion sensor. In this physics lesson, 7th graders match the graph shown by moving their body. They relate the slope to the way they moved.
Curated OER
Teaching about Data Interpretation
Students explore a variety of relevant lake water chemistry questions, compose responses, and present their results in a poster format. They, in pairs, answer questions about lake chemistry which are imbedded in this plan.
Curated OER
Learning to Make Data Tables
Students construct data tables using the results of previous experiments. In this graphing lesson, students plot data and interpret the results. Students discuss how they organized their data.
Curated OER
Learning to Make Bar Graphs
Students construct bar graphs using the results from various experiments. In this graphing lesson, students review data from a previous experiment and demonstrate how to construct a bar graph. Students use a checklist to ensure...
Center Science Education
Weather and Climate Data Exploration
Access local temperature data online, graph averages, and critique it. Learners listen to a scenario where weather and climate are confused, and then answer questions to differentiate the two. The lesson itself is compact, but there is a...
Curated OER
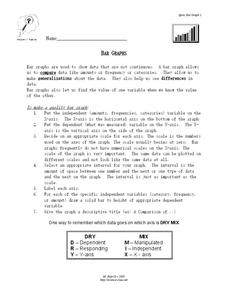
Bar Graphs
In this bar graph worksheet, students read about making quality bar graphs and they make a bar graph using given data. They answer 5 questions about their graph.
Curated OER
Data, Data, Everywhere... and What Am I To Think?
Students demonstrate good random sampling techniques for data collection, select and develop graphic presentations of data and analyze the data to solve a problem presented.
Curated OER
More Density Graph Questions
In this density graph learning exercise, students graph data displayed in a chart. Students also calculate the density of each metal shown in the graph. Students answer questions about which detail is more dense.
Curated OER
3 Kinds of Graphs
Students construct three different graphs-a line graph, a bar graph, and a circle graph. In this graphing instructional activity, students use different graphs to display various data that they collect.
Curated OER
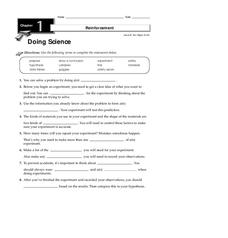
Doing Science
In this science experiment process worksheet, students will learn about the steps of conducting a science experiment, including creating a hypothesis, collecting data and drawing a conclusion. This worksheet has 8 fill in the blank...
Shodor Education Foundation
Plop It!
Build upon and stack up data to get the complete picture. Using the applet, pupils build bar graphs. As the bar graph builds, the interactive graphically displays the mean, median, and mode. Learners finish by exploring the changes in...
University of Colorado
The Moons of Jupiter
Can you name the three planets with rings in our solar system? Everyone knows Saturn, many know Uranus, but most people are surprised to learn that Jupiter also has a ring. The third in a series of six teaches pupils what is around...
Chicago Botanic Garden
Historical Climate Cycles
Ice core samples give scientists access to climates of old—those from more than 800,000 years ago. Through an analysis of various temperature graphs from ice cores, tree rings, and weather stations, scholars compare historical climates...


