Curated OER
"Measurement in Motion"
Ninth graders examine the rate of motion and changes in motion using a ramp and a rolling object. They conduct the demonstration, determine the average speed, and describe how a moving object can have zero acceleration and deceleration.
Alabama Learning Exchange
Can Plants Be Grown in Space?
Students investigate finding a solution to growing plants in space. They define key vocabulary terms, conduct an experiment growing plants, explore various websites, and participate in a live video conference with NASA regarding the...
Curated OER
Organizing Data
In this statistics activity, 11th graders collect data and organize it using a frequency table. They plot their data and analyze it using stem and leaf plots. There are 3 questions with an answer key.
Curated OER
Tables and Graphs Practice
For this table and graph worksheet, students are given three scenarios with data. They construct a table and a graph for each scenario.
Curated OER
Should Populations in an Ecosystem be Restricted?
Fourth graders experiment to determine how overpopulation effects ecosystems specifically plants. In this ecosystem lesson, 4th graders conduct an ecosystems experiment after listening to Claire Daniel's, Ecosystems. They watch a video,...
Curated OER
Measuring Rainfall and Relationships Between pH, Alkalinity and Suspended Solids in the Pago River
Eleventh graders test the pH and alkalinity of Pago River. In this ecology lesson plan, 11th graders collect data and use spreadsheet to graph results. They analyze and share their findings with the class.
Curated OER
Determining the Density of a Drop of Water-A Graphing Exercise
Middle schoolers determine the density of 1 drop of water. In this determining density lesson plan, students determine the mass and volume of a drop of water in the lab using appropriate lab techniques and calculate the density of a drop...
Curated OER
More Rocket Science
Young scholars observe two rocket science experiments, and create a graph to demonstrate the results. They draw a picture and write an explanation of the results of the experiments.
Curated OER
Environmental Issues in Multimedia Presentation
Students investigate a community environmental issue. They document it using traditional scientific methods, digital photography, and videotaping. After collecting data, they graph the results. Students present their findings in a...
Curated OER
Graphing Weather
Students make a graph. In this weather lesson plan, students fill in a KWL chart about different types of weather. Students watch a PowerPoint presentation about weather and natural disasters and where these types of weather are common....
Curated OER
Temperature in the Sun or Shade of the Desert
Third graders use thermometers to measure the air temperature in several
places around the school and then return to the classroom to record the data. They create a bar graph and discuss their findings about the air temperature in the...
Curated OER
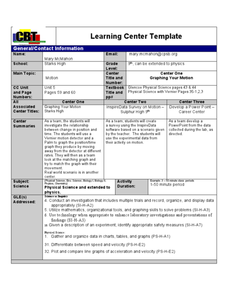
"Graphing Your Motion"
Students study the concepts of motion, velocity, and acceleration through graphing their own movement using LoggerPro. They explain the difference between speed and velocity using the weather vane example. They discover the difference...
Curated OER
Salt Front Data Set Activity
In this salt front learning exercise, students analyze data from the Hudson River and calculate highest and lowest River Mile locations as well as range of the salt front for each month on the data chart. After completing calculations,...
Curated OER
What's the Matter? Locating Electrons in an Atom
Learners roll dice in order to simulate the probability of locating an electron in a certain region around the nucleus.
Curated OER
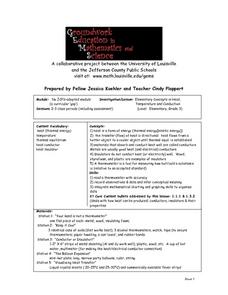
Elementary Concepts in Heat
Third graders read a thermometer with accuracy, record observations and data, and infer conceptual meaning. They integrate mathematical charting and graphing skills to organize their data. They explore what happens when they touch or use...
Curated OER
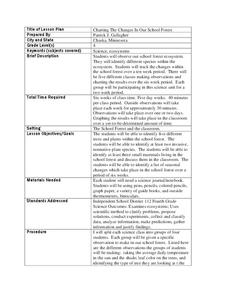
Charting the Changes in Our School Forest
Fourth graders investigate the ecosystem and how forests are disappearing. In this environmental protection lesson, 4th graders analyze the changes in their school for 2 weeks. Students practice identifying trees, birds, and foliage...
Curated OER
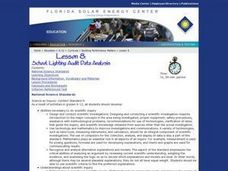
School Lighting Audit Data Analysis
Students analyze the data collected in the school lighting audit. They work together to write recommendations for more efficient lighting for their school. They practice using new vocabulary and working together with others.
Curated OER
Comparing Amount of Rainfall in Different Geographical Areas
Third graders create rain gauges and take them home. Individually, they record the rainfall amounts at all of their homes over a 2-week period and then bring the data back to class so they can compare the different amounts of rainfall...
Curated OER
Density Graph Questions
In this density worksheet, students use the mass of aluminum and copper at different volumes to create a graph in order to calculate the density of these metals. This worksheet has 1 graph, 2 short answer, and 5 word problems.
Curated OER
How Much Energy is Stored in Wood?
For this energy lesson, students create calorimeters out of soda cans and use them to calculate the amount of energy stored in different types of wood.
Curated OER
Comparing Data
Eighth graders create a survey, gather data and describe the data using measures of central tendency (mean, median and mode) and spread (range, quartiles, and interquartile range). Students use these measures to interpret, compare and...
Curated OER
What's in the Water?
Fifth graders use the dots to simulate water pollutants in a lake. They use cups to collect a sample of "water." Students sort the dots by color and record the number of each dot color under the correct pollutant name in the Lake Water...
Curated OER
Build a Catapult
Studens construct their own catapult. In this history of catapults lesson, students work in groups to make their own model of a catapult. Students use physics vocabulary terms explain how the catapult works. Students test the catapults...
Curated OER
Life Cycle: Diversity in a Balance 4th Grade Workbook
In this life cycle workbook, 5th graders examine plant and animal cells, classification of organisms, human biology, photosynthesis, and natural environments. 21 different activities make up the Life Cycle Workbook.


