Colorado State University
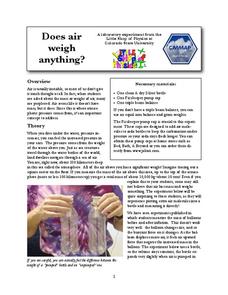
Does Air Weigh Anything?
Can you feel the weight of the air on your shoulders? Your classes may not believe that air has weight. A straightforward experiment asks individuals to weigh a bottle before and after adding air. Their results may surprise them!
Alabama Learning Exchange
Jelly Beans Add Up
Students explore counting, sorting, and graphing skills. In this data analysis lesson plan, students sort jelly beans by color, count the jelly beans, and create a bar graph of the jelly beans according to color.
Curated OER
You Light Up My Life
Students examine the relationship between solar activity and the Earth's geomagnetic field in producing the phenomena known as aurora borealis (Northern Lights) by reading and discussing "Earth, Wind and Fireworks." students graph data...
Curated OER
Earth Energy Budget Pre Lab
Students explore energy by conducting an in class experiment. In this climate change lesson, students conduct a water vapor experiment in a soda bottle. Students utilize graphs and charts to analyze the results of the experiment and help...
Curated OER
Take Another Look
Seventh graders analyze different types of graphs and answer questions related to each. In this math lesson, 7th graders organize a given diagram to make it easier to interpret. They discuss why they made such changes.
Curated OER
Good News - We're on the Rise!
Students build and observe a simple aneroid barometer to discover changes in barometric pressure and weather forecasting. They graph changes in barometric pressure for two weeks and make weather predictions.
Curated OER
A Tall Story
Students investigate the growth rate of a man named Bob Wadlow. In this growth rate of a man lesson, students determine if the growth rate of this particular man was normal or abnormal. Students bring in data of their height over time...
Curated OER
Making Connections-Review Experimental Design and Homeostasis
In this experimental design and homeostasis instructional activity, students complete 20 sentences with key terms about designing experiments, gathering data, graphing data and determining controls. They also complete sentences about...
Curated OER
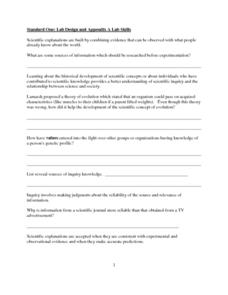
Standard One: Lab Design and Appendix A Lab Skills
In this lab design and lab skills worksheet, students answer questions about experimental design including finding variables, determining controls, and graphing data. They answer questions about microscopy and label the parts of a...
Curated OER
Bird and Breakfast
Students examine winter birds. In this KWL chart lesson, students fill out the chart and view a PowerPoint presentation. Students then complete the chart and discuss winter birds.
National Security Agency
Are You Ready to Call the Guinness Book of Records?
Learners design questions that can be answered by collecting data. In this line-plot lesson, pupils collect data and graph on a line plot on world records. An abundant supply of teacher support is provided in this resource.
Curated OER
Mystery Liquids: Linear Function
High schoolers determine the linear equations of the density of water and oil by collecting data on the mass of various volumes of each liquid. They construct scatter plots from the data and use these to write the linear equations for...
Curated OER
Scatter-Brained
Seventh graders graph ordered pairs on a coordinate plane. They create a scatterplot. Additionally, they determine the line of best fit and investigate the slope of the line. Multiple resources are provided. An excellent resource!
Science 4 Inquiry
A Whole New World: The Search for Water
Scholars find Earth won't support humans much longer and need to identify a planet with water to inhabit. They test four unknown samples and determine which is the closest to water. Then they explain and defend their results.
Curated OER
Quadratic Equations with the CBL 2
Learners practice generating parabolas with a motion sensor while determining the vertex form of the equation. They compare it to the regression equation from the calculator onto a data mate software. Each student completes several...
Curated OER
Sunspot Graphing
Students, using 15 years of sunspot data, plot data on a classroom graph. They discuss why the pattern from their individual sheets did not and could not match the class graph.
Curated OER
Using SWMP Data
Students are introduced to the SWMP system which tracks short-and long-term changes in water. Using this data, they plot and interpret the data on a graph to determine how human activities are lowering the water quality. They also...
Curated OER
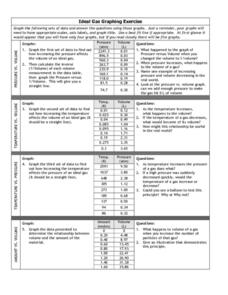
Graphing Exercise of Ideal Gas Data
For this graphing of Ideal Gas Data worksheet, students use the given data to draw 4 graphs of the given data. They are given the pressure and volume to draw and interpret the graphs.
Curated OER
Graphing Your Motion
Seventh graders investigate velocity and speed. In this Vernier Probe instructional activity, 7th graders will use probes to calculate motion, speed, and velocity of an object. They will create a graph of their collected data.
Curated OER
Means of Growth
Students collect and graph data. For this statistics lesson, students analyze their plotted data using a scatter plot. They identify lines as having positive, negative or no correlation.
Curated OER
Peat Pots
Students place a peat pot in water to observe and calculate the rate of capillarity in a model of a soil. This task assesses students' abilities to make simple observations, collect, record, and represent data, use a data table to...
Curated OER
Rainforest Data
In this geography learning exercise, students use the climate data given to create a temperature line graph and rainfall bar graph for each of three locations given. Then they use an atlas to compare their graphs and draw conclusions...
Curated OER
Position vs. Time and Velocity vs. Time Graphs
For this constant velocity worksheet, students use data of position vs. time of a roller-skater to determine speed, acceleration, or deceleration at different points along the path. Students rank graphs according to average velocity and...
Curated OER
Review of the Scientific Method
Learners review the Scientific Method with a hands-on activity. Working with a partner, they hypothesize the number of water drops that fit on the heads side of a penny. They collect data and share their results with the remainder of...


