Curated OER
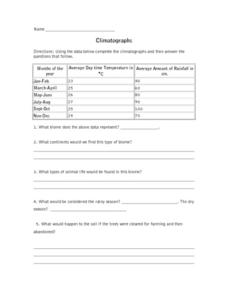
Climatographs
In this climatographs worksheet, young scholars are given 3 sets of data of the rainfall and temperature for 3 different biomes. Students identify the types of biome for each and answer questions about each. They make 2 graphs to compare...
Curated OER
Pick a Pet
Students construct a pictograph of favorite pets. In this pets and graphing lesson, students discuss their favorite pet and use animal magazines to find their favorite pets and cut them out. Students create a pictograph using the pictures.
Curated OER
What is a Seed?
First graders identify the parts of a seed. In this plant biology lesson, 1st graders are given a seed and identify each part of the seed by using a hand lens. Students plant a seed and graph the growth.
Curated OER
Weather "Whys" : Introduction to Weather
Students discuss weather forecasts and different types of weather. In this weather instructional activity, students observe the weather and learn a weather song. They listen to a story and see weather measurement tools.
Curated OER
Weather "Whys" Lesson 2 Seasons
Young scholars explore seasons. In this cross curriculum weather and seasons lesson plan, students identify characteristics of the four seasons and sequence related pictures. Young scholars listen to poems and stories about trees in...
Curated OER
Shake, Rattle, and Roll: Mt. St. Helens - Lesson Plan 2
Students compile information on volcanic activity at Mount St. Helens. In this earth science instructional activity, students use the information they gathered on Mount St. Helens to answer questions and create charts in Excel. Then...
Curated OER
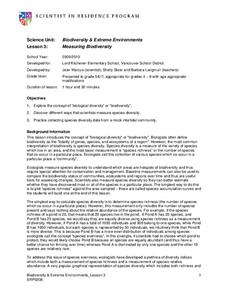
Measuring Biodiversity
Students collect species data from a mock intertidal community. In this biology lesson, students graph their data and analyze the species in it. They construct a species accumulation curve and present it to class.
Curated OER
Moving Bodies
In this moving bodies worksheet, students investigate how the amount of mass of a body in motion affects its tendency to remain in motion. Students use a meter stick as a ramp, marbles, string and a wooden block to determine how far a...
Curated OER
You’re Tugging at Me!
Students study the sliding and rolling friction. In this forces instructional activity students divide into groups and use a cart to examine the amount of force that is used to move objects.
Curated OER
Tsunami Simulation Experiment
Learners examine the importance of tsunami warning systems. They read and discuss an article, conduct an experiment in a wave tank, calculate wave velocities of tsunamis, and identify what happens to tsunamis as they approach a shoreline.
Curated OER
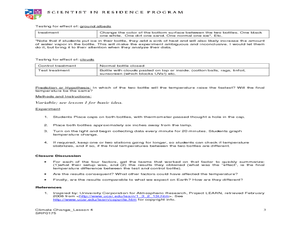
Earth Energy Budget Lab
Students conduct experiments showing the greenhouse effect. In this scientific experiment lesson plan, students test for CO2 concentration, water vapor, ground albedo, and clouds. They describe what factors affect temperature and how...
Curated OER
Exploring Alternative Energy Sources
Students research the amount and kinds of energy that are produced and consumed in the United States, including the limitations of this kind of consumption. They research and create a display to teach classmates about a specific...
Curated OER
Native Species Restoration and its Impact on Local Populations
In this native species restoration worksheet, students are given 3 scenarios to choose from to help restore a declining population of an endangered species of deer. Students make predictions about what they will think happen when the...
Curated OER
What is That Smell?
Students identify various scents by using their sense of smell. In this five senses lesson, students smell items such as popcorn, mint, and lemon and identify the scents by only using their sense of smell.
Curated OER
Show Me!
Students analyze and interpret graphs. In this graphing lesson, students view a video and construct their own graphs (line, circle, bar) from given sets of data.
Curated OER
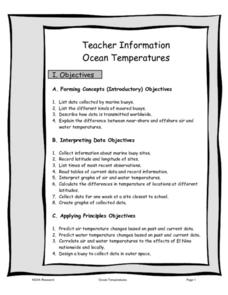
Ocean Temperatures
Students list data collected by marine buoys and the different kinds of moored buoys. They describe how data is transmitted worldwide. They explain the difference between near shore and offshore air and water temperatures.
Curated OER
The Blizzard of 1993
Students read and interpret the information from a barograph from a major winter storm. This task assesses students' abilities to interpret and analyze graphs, construct data tables and graphs, generalize, infer, apply knowledge of...
Curated OER
Human Activity and the Environment
Students review and analyze graphs and tables as a group. They develop their graph and data analysis skills by converting data tables from Human Activity and the Environment into graphs.
Curated OER
La Toteca- A Tropical Paradise
Young scholars collect data on the time of the ferry. In this algebra lesson, students use the data to predict a ferry schedule. They also compute the depth where oxygen would be needed when diving.
Curated OER
Laws of Motions
Seventh graders explore the Laws of Motion. They define friction and explain the concept of inertia. Students explain what happens when a force is exerted on an object that is in equilibrium. They state the second and third laws of motion.
Curated OER
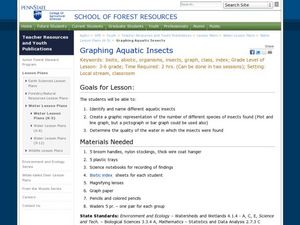
Graphing Aquatic Insects
Students identify aquatic insects. For this organism lesson, students locate aquatic insects near a local waterway and collect them. Students graph the amount of insects that they collected.
Curated OER
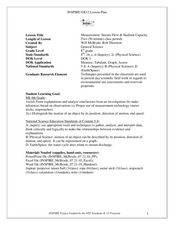
Measurement: Stream Flow & Stadium Capacity
Eighth graders study the scientific fields and how information can be monitored and recorded. For this scientific inquiry lesson students view a PowerPoint presentation and complete a hands on activity.
Curated OER
Gathering, Recording, and Presenting Data
Sixth graders use the local newspaper to find and discuss examples of uses of statistics and the ways in which the information is presented. They create and represent their own set of data showing how students get to school each day.
Curated OER
Radioactive Decay
Students generate a radioactive decay table for an imaginary element, use their data to plot a decay graph, develop the concept of half-life, and use the graph to "age" several samples.


