Curated OER
Water Down the Drain
Did you know that leaky faucets waste $10 million worth of water? Conservationists perform an experiment and draw best-fit lines to explore how the US Geological Society determined this value.
Teach Engineering
Breaking the Mold
A little too much strain could cause a lot of stress. Groups conduct a strength test on clay. Using books as weights, pupils measure the compression of clay columns and calculate the associated strain and stress. Teams record their data...
Shodor Education Foundation
Box Plot
What information can come from a box? Learners choose a data set to display as a box plot and decide whether to include the median in the calculation of the quartiles, show the outliers, and change the scale. To finish the lesson,...
Teach Engineering
Energy on a Roller Coaster
Roll with your class into the idea of conservation of energy. Pupils use a roller coaster track to collect data to reinforce the concept of conservation of energy and the influence of friction. Class members then create a graph from...
Statistics Education Web
Double Stuffed?
True or false — Double Stuf Oreos always contain twice as much cream as regular Oreos. Scholars first measure the masses of the filling in regular Oreos and Double Stuf Oreos to generate a class set of data. They use hypothesis testing...
Concord Consortium
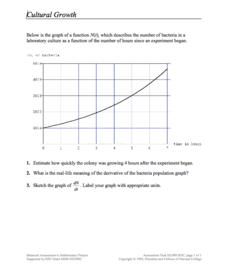
Cultural Growth
Scholars read and interpret a graph relating bacterial growth in a culture over time. They apply knowledge of derivatives, estimation, and graphing to the skill practice questions.
Curated OER
Matrix Madness!!
Perform operations to add, subtract, multiply and divide matrices. Then solve problems with vectors using matrices. A three day activity: Matrix Madness, Mystical Matrices, and Decode the Encode. The last activity has prizes that the...
Teach Engineering
Making Moon Craters
Create an egg-citing study of energy. Pupils investigate the effect of height and mass on the overall amount of energy of a falling object. The fourth segment in a six-part series on energy uses a weighted egg falling from different...
National Research Center for Career and Technical Education
Hospitality and Tourism 1: Safety and Sanitation
Math and science come alive in this career-related instructional activity on sanitation. Along the way, learners explore bacterial growth rates using exponential notation and graphs. A link to a very brief, but vivid video shows just how...
Teach Engineering
Pointing at Maximum Power for PV
Following detailed directions, teams collect the voltage and current outputs of a photovoltaic cell by adjusting the resistance. Using the collected data, they determine the highest power output. Implications for weather and a large...
Teach Engineering
Concentrating on the Sun with PVs
Concentrate to determine the best reflector design. Pairs use the engineering design process to build a reflector to increase the current output of a photovotaic panel. Teams arrive at a final design and present it to the class along...
Science 4 Inquiry
The Yin and Yang of Photosynthesis: Day vs. Night
Floating fragments of elodea can grow even without roots. Young scientists use eldoea plants to observe the oxygen production from photosynthesis. They study the difference between having access to high amounts of light and low amounts...
Teach Engineering
Air Pressure
Investigate what is pushing on us. An intriguing activity has pupils calculate the amount of force on various squares due to air pressure. Using the data, individuals create a graph in the third activity of the Up, Up and Away unit...
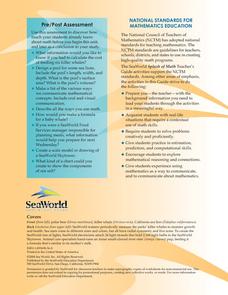
Sea World
Splash of Math
How can kids use math to learn about marine life? Combine math skills with science lessons in a resource featuring activities about life in the sea. Kids graph and calculate data, solve complex word problems, measure geometric shapes,...
Mathematics Vision Project
Quadratic Functions
Inquiry-based learning and investigations form the basis of a deep understanding of quadratic functions in a very thorough unit plan. Learners develop recursive and closed methods for representing real-life situations, then apply these...
Teach Engineering
How Effective is Your Sunscreen?
Protect skin from UV radiation! Groups design and conduct an experiment to test the effectiveness of UV safety products. The groups collect the data from the experiment and prepare a lab report. In the second day of the activity,...
Missouri Department of Elementary
Are You Balanced?
Balance scales create a strong visual of how an individual prioritizes one's self alongside their commitments to the community, school, and home. Scholars complete a graphic organizer then discuss their findings with their peers. A...
Curated OER
Seasons and Cloud Cover, Are They Related?
Students use NASA satellite data to see cloud cover over Africa. In this seasons lesson students access data and import it into Excel.
Curated OER
A Fishy Tale
Eighth graders do a research project on a particular species of Atlantic seafood and record and graph information pertaining to commercial landings of that species of seafood. They use a website and an Appleworks spreadsheet.
Curated OER
Probability: The Study of Chance
Students conduct an experiment, determine if a game is fair, and collect data. They interpret data, then display line graph. They conduct analysis of game for probability.
Curated OER
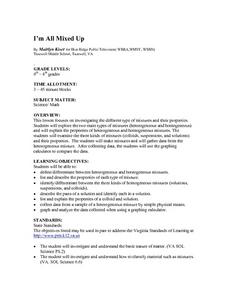
I'm All Mixed Up
Middle school scientists compare and contrast heterogeneous and homogeneous mixtures. They differentiate solutions, colloids, and suspensions by examining samples of each. Note that the bulk of the lesson plan directs you how to...
Curated OER
MAISA and the REMC Association of Michigan
Students complete online research to study geography's impact on weather. In this geography and weather lesson, students research weather in their city for ten days using an online website. Students bookmark the site, enter data into a...
Curated OER
Weather Lesson
Learners discuss the weather conditions. They read thermometer, rain gauge, barometer, and wind direction and speed. They record observations of weather conditions and enter information into data base on the computer.
Curated OER
Sundials and Shadows - What Can They Teach Us About Seasons?
Pupils collect and analyze data relating to seasonal changes. They view a video, research web sites and build a sundial to collect their data.


