Virginia Department of Education
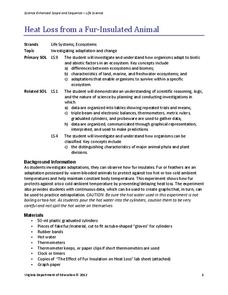
Heat Loss from a Fur-Insulated Animal
How do animals adapt to weather changes? Provide your class with the ability to understand adaptations and body temperature as they participate in this hands on experiment, using fake fur and hot water. Pupils collect data and analyze...
Beyond Benign
Exothermic and Endothermic Reactions
How can you tell the difference between endothermic and exothermic reactions? Chemistry scholars perform and observe two chemical reactions, measure the temperature throughout, then draw conclusions about changes in energy from their...
Curated OER
Tell Us All: Tools for Integrating Math and Engineering
What a scam! Middle and high schoolers pose as journalists exposing consumer fraud. In this lesson, they write an article for a magazine using data collected during previous investigations (prior lessons) to defend their findings that a...
Virginia Department of Education
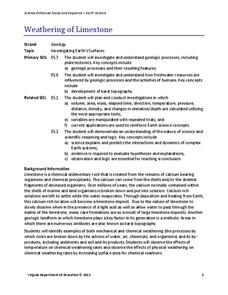
Weathering of Limestone
We all know limestone weathers, but what affects the rate of weathering? Young scientists investigate the physical and chemical weathering of limestone (chalk) through experimentation. First, they conduct trials with different-size...
PBS
Analyzing Light Curves of Transiting Exoplanets
Scientists detected exoplanets by measuring how the brightness of stars changed over time. Young astronomers interpret and analyze the same data that led to exoplanet discoveries. They learn to apply light curve graphs and connect the...
Curated OER
Weather, Data, Graphs and Maps
Students collect data on the weather, graph and analyze it. In this algebra lesson, students interpret maps and are able to better plan their days based on the weather reading. They make predictions based on the type of clouds they see.
Curated OER
Applied Science - Science and Math Lab
Students make a prediction. In this applied science instructional activity, students guess the number of items in a jar. Students create a bar graph to show the predictions and the actual amounts.
Curated OER
Mass/Weight/Data/Graphing-What Is The Mass of a Dinosaur?
Students determine the mass of various "dinosaur eggs" and graph their data. In this mass, weight, data and graphing lesson plan, students measure the mass of different weighted "dinosaur eggs". They record their data and transfer it to...
Curated OER
Graphing the Weather
Fourth graders predict the weather for their area using simple weather instruments. They take readings for a month during a season and graph their results. Students describe weather patterns based on their data and predict future weather...
Curated OER
Applied Science - Science and Math Post-Lab
Students explore optical illusions. In this Applied Science lesson, students view optical illusions and record the data of what they see. Students graph the data that they collect.
Curated OER
How Much Water Is Available In The Atmosphere For Precipitation?
Students explore the relationship between the available water in the atmosphere and how it is portrayed on satellites. After examining global moisture and precipitation students research precipitation data graph the results. Using their...
Curated OER
It's In The Chocolate Chips
Students investigate which brand of chocolate chip cookies contains the most chocolate. They analyze and compare data using Microsoft Word and Microsoft Excel. They communicate the results with Microsoft PowerPoint.
Curated OER
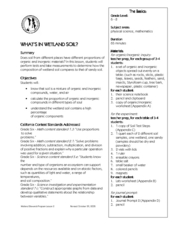
What's in Wetland Soil?
Students examine the organic and inorganic components of soil. For this environmental science lesson, students identify the factors that influence soil formation. They collect soil samples, conduct tests, and analyze the results.
Discovery Education
Sonar & Echolocation
A well-designed, comprehensive, and attractive slide show supports direct instruction on how sonar and echolocation work. Contained within the slides are links to interactive websites and instructions for using apps on a mobile device to...
Institute of Electrical and Electronics Engineers
Get Connected with Ohm's Law
Ideal for your electricity unit, especially with middle schoolers, this lesson plan gets engineers using multimeters in electrical circuits to explore the relationships among voltage, current, and resistance. Older learners may even plot...
Curated OER
Science: Lead Shot and Waterfowl
Students examine data to investigate the impact of lead shot pellets on waterfowl populations. They graph their findings and discover how lead in ingested by birds and poisons them. As an extension, students research legislation and...
Science 4 Inquiry
Journey Through the Spheres of the Earth
Each of the Earth's spheres interacts with the other spheres in predictable ways. Young scientists explore these interactions through a hands-on activity, graphing, and watching a video. They summarize their knowledge in a video or...
US Environmental Protection Agency
Carbon Through the Seasons
Meteorologists view an animated video by the Environmental Protection Agency to learn how the carbon cycle works, and then move into groups to analyze and graph actual data of the atmospheric carbon dioxide concentration from Hawaii's...
Science 4 Inquiry
States and Phases of Matter
Plasma is the most common phase of matter in our universe. Scholars explore the change of energy as molecules change phases of matter. They rotate through stations, graphing the changes in energy level.
Curated OER
Lab Experiments in Nutrition
Looking for authentic hands-on nutritional experiments? High schoolers will perform experiments to test for the presence of vitamin C in several solutions as well as the effect of caffeine on Daphnia. They will also consider the...
Curated OER
Riding on a Pendulum
A comprehensive resource gets fourth grade physical scientists making observations about the period of a pendulum and then applying knowledge to a playground swing. Through seven different stations, they will record observations and...
Baylor College
Heart and Lungs
With a partner, youngsters measure their pulse and breathing rates, both at rest and after running in place for a minute. While this activity is not novel, the lesson plan includes a large-scale classroom graphing activity and other...
Rainforest Alliance
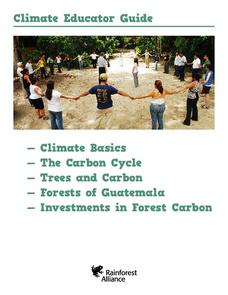
Climate Educator Guide
Climate change is a hot topic in the news. Class members examine carbon dioxide data to analyze trends of our atmospheric makeup over time. They also discuss climate and climate change, and determine how these changes are affecting life...
American Chemical Society
Evaporation
This is one in several lessons that explore the relationship between temperature and phase changes of water. After some discussion, elementary physical scientists place wet paper toweling on a hot and a room-temperature water bag and...


