Bowland
Alien Invasion
Win the war of the worlds! Scholars solve a variety of problems related to an alien invasion. They determine where spaceships have landed on a coordinate map, devise a plan to avoid the aliens, observe the aliens, and break a code to...
Curated OER
Exploration of "Pillbugs"
Fifth graders define vocabulary terms, identify the characteristics of a pillbug, and create a dichotomous key. Then they examine the pillbugs and make observations and record these observations. Finally, 5th graders observe specific...
Curated OER
Adaptations to Niches and Habitats
Life science learners measure and record traits of seeds, leaves, and their own hands and then graph the data to find a continous distribution curve. They compare and color diagrams of seven different animals' forelimbs (not included),...
Balanced Assessment
Who's Left?
If you're not right-handed, are you wrong-handed? Young statisticians calculate the percentage of left-handed people using a given data set in the assessment task. They plot data on a scatter plot and consider how the line of best fit...
Kenan Fellows
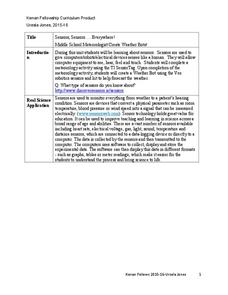
Sensors, Sensors…..Everywhere! Middle School Meteorologist Create Weather Bots!
My forecast is that you'll want to use the resource. Pupils design and create a weather bot as part of a project-based unit. These bots should be able to measure temperature, humidity, barometric pressure, wind speed and direction, and...
Curated OER
Discovering Pi
Define terminology related to a circle. Practice accuracy in measuring and then create a spreadsheet based on data collected from solving for parts of a circle. Groups can have fun analyzing their data as it relates to Pi.
Curated OER
Missing Macroinvertebrates - Stream Side Science
Field study groups collect samples of stream water and identify the macroinvertebrates found. Using their data, they calculate a water quality index to rate the health of the stream. They graph their data and discuss the value of a water...
Mascil Project
Chocolate Chip Mining
Canada mines more minerals than any other country in the world. Scholars with a sample must determine how to get the mineral out while preserving as much of the rock as possible. They analyze the data and compare methodology while...
Curated OER
The Appliance Explosion
Students explain why the number of appliances used today differs greatly from the number used previously. They construct a bar graph to show changes in appliance use over a period of time. They also list appliances that could be eliminated.
Curated OER
2nd Grade - Act. 23: Sprout Houses
Read the story "Sunflower House," by Eve Bunting with your 2nd graders to investigate the relationships between plants and animals. They will discover how living things change during their lives by creating their own sprout houses. In...
Global Change
Impact of Climate Change on the Desert Pupfish
A fish that lives in the desert? You and your class can meet the desert pupfish as they examine its habitat, the role humans play in diminishing water supplies, and how climate change might impact this fishy friend. There are four short...
Curated OER
Math Games for Skills and Concepts
A 27-page packet full of math games and activities builds on algebra, measurement, geometry, fractional, and graphing skills. Young mathematicians participate in math games collaboratively, promoting teamwork and skills practice.
Curated OER
Acceleration Science
In collaborative groups, physics learners design and create a web portfolio of internet resoucres explaining poitive and negative acceleration, zero acceleration, and positive and negative velocity. This is a terrific assignment for...
Curated OER
California Here We Come!
A highly relevant and great cross-curricular project! In teams, your class will plot a course from the East Coast to Sacramento, California passing through all of the state capital cities along the way. As part of the journey, teams will...
Council for Economic Education
The Economics of Income: If You’re So Smart, Why Aren't You Rich?
If basketball players make more than teachers, why shouldn't learners all aspire to play in the NBA? Unraveling the cost and benefits of education and future economic success can be tricky. Economic data, real-life cases, and some...
Curated OER
Let Me Tell You About My State
State reports can be a lot of fun, especially when the learners get to choose the state they study. This research and writing-focused social studies lesson engages learners in collecting information, essay structure, research, and...
Curated OER
T3 Lesson Plan: Number 3
Sixth graders investigate local water. For this water cycle lesson, 6th graders take samples from surrounding water sources. Students record data from the samples, compare and graph the results.
Curated OER
Teaching About the Ozone Hole
A PowerPoint and an accompanying worksheet introduce young meteorologists to the hole in the ozone layer. Another handout provides a coloring and graphing activity which examines the changes in the ozone. There are also links to neat...
Alabama Learning Exchange
Building Functions: Composition of Functions
Hammer away at building different types of functions. An engaging lesson plan builds on learners' knowledge of domain and range to create an understanding of composite functions. Young scholars learn to write composite functions from...
Curated OER
Unit 2: Lesson 7
Students are introduced to spreadsheets. They conduct a survey of television viewing time of different shows based on different age categories. Students work in small groups. They collect, data and interpret the data from a survey.
Curated OER
Bones and Math
students identify and explore the connection between math and the bones of the human body. Students collect data about bones from their classmates and from adults, apply formulas that relate this data to a person's height, and organize...
Curated OER
Spyglass Transform
Students transfer information previously saved in a spreadsheet to Spyglass Transform. They visualize the data and explain what it means
Curated OER
Exploring Scale
Sixth graders discuss how the scale and type of graph can change how the data appears. With a partner, they identify all the information about the graph in a specific amount of time and record them in a journal. To end the lesson, they...
Curated OER
Discovering Demographics
High schoolers analyze demographic data including a statistical overview of India. Students synthesize their findings and create an informational poster about India.


