Curated OER
The Study of Urban and Suburban Environments within the Mystic River Watershed
High school students examine their own water-based environments, within the Mystic Watershed. As the learners engage in inquiry-based, hands-on projects, critical thinking skills and problem-solving, the project will lead them to cross...
Curated OER
Getting to Know You
Students read a book about understanding differences. In this getting to know you lesson, students sit in a circle, roll a ball to each other and tell one thing about themselves when they get the ball. Students read the book One and...
Curated OER
Gravity, Angles, and Measurement
Students relate math to real life scenarios. In this geometry lesson, students launch a ball tracking each launch using a graph. They analyze their data for speed, angles and distance, trying to improve on each launch.
Curated OER
Giant Mystery
Third graders determine the relationship between hand size and body size using centimeters as the unit of measure, They use the relationship to find the size of a hypothetical giant. They graph the measurements using a spreadsheet program.
Curated OER
Assimilation in America
High schoolers, after reading the novel, "The Joy Luck Club," create a four question survey about assimilation in America. They each ask four members of their family or peers to take the survey. After data is collected, they create...
Curated OER
Global Warming Statistics
Learners research and collect data regarding temperature changes for a specific location and find the mean, median, and mode for their data. In this climate change lesson plan, students choose a location to research and collect data...
Curated OER
Let's Keep Track of Grades
Students participate in a technology project. This lesson is a hands-on spreadsheet project where students are responsible for keeping track of their grades for class. The students learn to enter data into a spreadsheet, create...
Curated OER
Equations Lesson Plan
Seventh graders play "What's my Rule" beginning with simple equations and working towards harder problems as student's gain confidence. They evaluate the equations by graphing them. Students identify the slope and y intercepts of the...
Curated OER
Monitoring Estuarine Water Quality
Students analyze water quality data from real data. In this environmental science lesson, students examine how salinity and dissolved oxygen affect the living organisms in the estuary. They interpret graphs to support or disprove a...
Curated OER
Determining Mean, Range, Median, Mode, and Probability
Students calculate mean, median, range, mode and probability. Then, working in teams, they use data from their workplace to compute values for these terms. Finally the class explores the term "probability" using a die.
Curated OER
Texas Regions and Native Americans of Texas
Fourth graders research to find the regions of Texas. In this technology instructional activity, 4th graders create a Kid Pix project showing the location of various regions of Texas. Students show where in those regions Native...
Curated OER
Square Foot Garden
Students plant a garden and keep track of it. In this geometrical garden lesson plan, students collect data from their garden twice a week. They graph their finding and figure out how many square feet of growing space each person needs...
Curated OER
Ready, Set, Go!
Middle schoolers predict if the height of a ramp affect how far an object travels. They design and conduct an experiment to test their predictions. The results are recorded and a graph is created to show the relationship between ramp...
Curated OER
Cities
Students examine U.S. Census figures. In this urban centers lesson plan, students compare city populations across the span of 50 years. Students create line graphs based on the data.
Curated OER
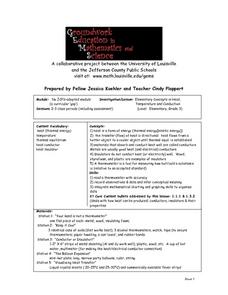
Elementary Concepts in Heat
Third graders read a thermometer with accuracy, record observations and data, and infer conceptual meaning. They integrate mathematical charting and graphing skills to organize their data. They explore what happens when they touch or use...
Curated OER
Solar Cycle
Students explore the solar cycle through a series of experiments. In this space science lesson, students construct and evaluate solar cycle graphs. They explain how this phenomenon affects the Earth.
Curated OER
Be a Structural Engineer!
Students investigate how to design and build items with a focus on structural strength as an engineer would. They complete a truss-building project as a final assessment.
Curated OER
1st Grade - Act. 04: Chrysanthemum and Letter Tiles
First graders listen to story Chrysanthemum, discuss story with a focus on the length of Chrysanthemum's name, and compare the lengths of their own names using letter tiles, grid paper, and a class graph.
Curated OER
Testing for Vitamin C in Different Drinks and Foods
Students examine the importance of vitamin c in their diets and the sources that it comes from. In this vitamin lesson students complete hands on activities, interpret data and make a bar graph.
Curated OER
Poetic Math Greeting Cards
Fourth graders work in groups; collect data in a survey; depict in tables, charts, or graphs the results of the survey; and make predictions. They use creative writing skills and computer skills to generate a greeting card of their own.
Curated OER
Good News - We're on the Rise!
Students build and observe a simple aneroid barometer to discover changes in barometric pressure and weather forecasting. They graph changes in barometric pressure for two weeks and make weather predictions.
Curated OER
Urban Effects on Inshore Plankton
Students investigate the effects of urban pollution on plankton. In this plankton and pollution lesson plan, students use samples of plankton collected in urban areas to observe the effects of pollution on plankton samples. They...
Curated OER
T-Shirt Lettering
Students determine the cost of a t-shirt using a variety of mathematical operations to solve problems. Then they use a spreadsheet to calculate the cost of lettering a t-shirt and display this information in a graph.
Curated OER
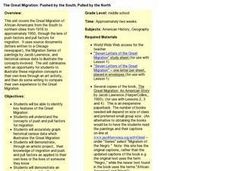
The Great Migration: Pushed By The South, Pulled By The North
Learners identify key features of the Great Migration. They explain the concepts of push and pull factors for migration. They create an art project which shows an understanding of the push and pull factors.


