Curated OER
Scientific Inquiry: Periodic Motion
Students construct their own pendulum. In this physics activity, students design an experiment to find the factors affecting its period. They formulate a conclusion based on experimental data.
Curated OER
Home on the Biome
Fifth graders study six major biomes, graph temperature and rainfall, and present their findings to the class.
Curated OER
Testing for Vitamin C in different drinks and foods
Students develop an awareness of the use of Vitamin C in helping our environment and gain exposure to chemical procedures and techniques. Students analyze and interpret data by keeping a data sheet and making a bar graph.
Curated OER
Tracking Sunrise and Sunset
Young scholars collect, record, and graph the sunrise and sunset times. They explain how the relationship between the tilt of Earth's axis and its yearly orbit around the sun produces the seasons.
Curated OER
Growing Plants with Worm Castings
Students test worm castings for content and use them to grow seeds. They hypothesize which castings best sustain seed growth. They observe growing plants to test their hypotheses. Later they graph their data.
Curated OER
Responsibility: Caring for Classroom Virtual Pets
Students define the term "responsibility". As a class, they participate in voting on different ideas presented to them and develop a graph showing the results. They use the internet to virtually take care of the adopted pet of the class.
Curated OER
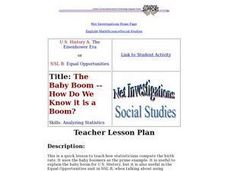
The Baby Boom -- How Do We Know it is a Boom?
Students examine graphs of three statistics and use basic math to compute their own. They evaluate the implications of manipulating data and whether statistics are appropriate for creating policy.
Curated OER
Ratios Through Social Studies
Students analyze and integrate mathematical concepts within the context of social studies. They gather, present and analyze information on a bar graph, pie chart, etc. Students compute ratios. They demonstrate that ratios have real-world...
Curated OER
Technology: Programming Graphics
Students use the DrScheme program to create graphics for clip art. Using graphics, they plan their designs using basic shapes, plotting its positions, and studying the relationships between points. By plotting the necessary data on...
Curated OER
Age Structure Studies
Students collect data from Internet sources to compare age distributions in their city, county or state with that of other places in the US or other countries. They construct and interpret age-structure population pyramids and research...
Curated OER
Volatile Volcanoes
Students have fun with graphics, graphs and money, simultaneously learning with up-to-the-minute information.
Curated OER
It's All in the Air
Young scholars examine air quality. They test the air for visible pollutants by observing jars for one week and compare and contrast the data they collect. After comparing and contrasting the data, they graph the results of pollution...
Curated OER
Mathematical Models with Applications: What's Your Rate of Change?
Students use regression methods available through technology to select the most appropriate model to describe collected data and use the model to interpret information. They use numeric techniques to write the equation of a line that...
Curated OER
Solar Storms
Young scholars investigate the cycles of solar activity. They plot the solar activity and use the graph to answer a number of questions and explain the relationship between the solar storms and sunspots and the impact on earth and space...
Alabama Learning Exchange
The Composition of Seawater
Students explore the concept of finding the composition of seawater. In this finding the composition of seawater instructional activity, students make a saturated salt water solution. Students discuss why there is variation in ocean...
Curated OER
Is There a Doctor in the House
Sixth graders predict outcomes of research. They analyze data and construct a class graph, then work cooperatively in a small group setting. They explain the prevention aspect of medicine, document references, and continue ongoing...
Curated OER
Parched! No Water, No Town
Young scholars discuss the benefits of water conservation. Given a data sheet, they document their water usage over a specified period. Water usage data is graphed and analyzed. Students discuss ways in which they can conserve water.
Curated OER
Collect Your Own Drosophila Lab
Students study Drosophila by catching them. They construct catcher-containers to catch Drosophila using fruit as bait. After collection, they examine the flies and collect data to be displayed.
Curated OER
Healthy Foods
Students illustrate their favorite food and add it to a food pyramid graph, after listening to Russell Hoban's story, Bread and Jam for Frances.
Curated OER
What is the Problem of Boston Harbor?
Pupils recognize the affects of technology on the environment. They examine data to determine methods to improve waater quality. A research paper is written to desribe recommendations for improving water in the future.
Curated OER
Numerical Determination of Drag Coefficients
Students create a video of an object falling with a drag. In this physics instructional activity, students calculate drag coefficient using data from Logger Pro. They calculate velocity and acceleration of the object.
Curated OER
How Hot Is It?
Sixth graders use paper cups, black and white lining, thermometers and plastic wrap to conduct an experiment that measures the energy-collecting capacity of various colors. They graph the results.
Curated OER
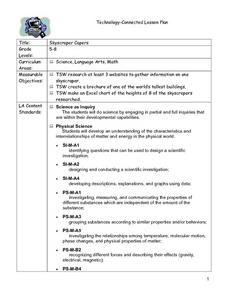
Skyscraper Capers
Young scholars discuss skyscrapers and listen as the teacher introduces the project. They use the Internet to perform research on one skyscraper. Students use information they gather to create a brochure of their building . They create...
Curated OER
Line Best Fit
Learners identify the line of best fit. In this statistics lesson, students analyze graphs and plots to identify positive, negative or no correlation. They find the line of best fit for different scatter plots.


