Curated OER
The Research Paper - Searching for a Subject
Students research a website to look for potential topics for a research paper. They develop a narrowed prioritized subject list on an index card (3X5) using word processing program.
Curated OER
Counties of Michigan
Fourth graders complete an atlas worksheet to become familiar with the types of information found in an atlas.
Curated OER
What's the Problem?
Fourth graders redefine the problem of Where's the Heart of Florida? and begin to formulate possible solutions using graphic organizers.
Curated OER
The People Behind the Numbers
Tenth graders brainstorm potential definitions for "developed" and "developing" countries. They work in groups of four and research using Web sites listed to find information about their country then they create a spreadsheet which...
Curated OER
Gwynns Falls
Students investigate the question: What is the impact of urban development and expansion on the health of a decidious forest ecosystem and humans? They examine the issue of land development by responding to a specific scenario and...
Curated OER
Reservoir Activity
Students research the economic importance of the major reservoirs in Illinois. In groups, they manage a budget for one of the lakes to promote tourism in the area. They also work together to create advertisements.
Curated OER
Owning a Pet
Fourth graders identify and use different forms of writing for various purposes. Using the internet, they read and gather information and write quesitons for their own investigations on the various pets they could own. They practice...
Curated OER
What's Going to Happen at Any Given Barometer Reading?
Fourth graders brainstorm a list of words associated with weather. In groups, they sort the words into categories and observe the weather in their area for a month. To end the lesson, they compare the barometer measurements for a...
Curated OER
Go Yankees!
Students use the internet to research the New York Yankees baseball team. After gathering their information, they discuss the challenges faced by the team and how they were overcome. They end the lesson by examining the math and...
Curated OER
Water Taste Test
Young scholars brainstorm the different characteristics of potable water. In this general science lesson plan, students test several water samples and hypothesize which samples and brands they are. They discuss where drinking water came...
Curated OER
Physical Pendulum Lab
Students calculate the moment of inertia of a disc. In this physics lesson plan, students differentiate the two methods used in finding the inertia. They construct their own pendulum for the lab.
Curated OER
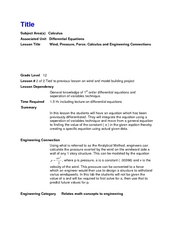
Wind, Pressure, Force, Calculus and Engineering Connections
Twelfth graders solve first order differential equations using the separation of variables technique. In this calculus lesson, 12th graders explain the connection between math and engineering. They brainstorm what engineers do in real life.
Science Buddies
Science Buddies: Interpreting Area Data From Maps vs. Graphs
Graphical methods of data presentation are a key feature of scientific communication. This project asks the question, "What's the best way to compare the land area of states: a map or a bar graph?" You'll be measuring performance on two...
Other
A River Runs Through It Learning Project
In this year long learning project integrating mathematics and science, students solve environmental problems using data collection and problem solving concepts. Designed for upper elementary gifted students. Interactive components and...
Center for Innovation in Engineering and Science Education, Stevens Institute of Technology
Ciese Real Time Data Projects: Weather Scope: A Study of Weather and Climate
Use real-time data to study factors that affect weather and climate, create weather instruments, and share data with students around the world.
Science Buddies
Science Buddies: Scientific Method Data Analysis/graphs
At the end of your experiment you should review all of the data you have collected. See samples of data analysis charts and graphs. Find out what makes for a good chart or graph using the self-grading rubrics.
University Corporation for Atmospheric Research
Ucar: Project Sky Math
Teachers will be interested to explore the SkyMath module, and the 16 classroom activities at this site. In this program, students will collect and record real-time weather data to analyze. Data analysis, graphing, number relationship,...
National Council of Teachers of Mathematics
The Math Forum: Seventh Grade Mathematics: Data Sense
This site has some interesting ways to collect and evaluate data. There are some activities about note taking, spreadsheets, surveys, and a cool bridge construction project. Teachers may want to use this site as a resource for some...
Alabama Learning Exchange
Alex: Great Golly Graphs
This lesson plan asks learners to create a survey project including graphs, questions, tables, and data analysis. It gives an assessment and ideas for remediation and extension as well as ways to manage behavior problems and reluctant...
Science Buddies
Science Buddies: An Experiment in Visual Perception
Graphical methods of data presentation are a key feature of scientific communication. This project will get you thinking about how to find the best way to communicate scientific information.
Alabama Learning Exchange
Alex: "Ridin' Along in My Automobile"
Students will research prices of used cars to discover how automobiles lose their value over time. Students will create a chart to record their information, use their chart to graph their data, and find measures of central tendency of...
Alabama Learning Exchange
Alex: Incline Plane and the Crashing Marble
Learners will measure the effects of the height of an inclined plane on the force a marble produces to move a plastic, foam, or paper cup across a table. Students will discover that the higher the incline plane, the more force produced...
Alabama Learning Exchange
Alex: Misleading Graphs Are Da'pits!
In this interactive lesson, students will discover how creating an incorrect graph will display misleading information. Through viewing and discussing a variety of graphs, the students will identify 5 components that graphs must contain...
Science Education Resource Center at Carleton College
Serc: Analyzing Greenhouse Gases and Global Temperature Data Over Time
In this activity, students plot data on the concentrations of various greenhouse gases in Earth's atmosphere and look for trends. They will learn that greenhouse gases allow the Sun's light to pass through them to the surface of Earth,...


