Alabama Learning Exchange
Alex: Misleading Graphs Are Da'pits!
In this interactive lesson, students will discover how creating an incorrect graph will display misleading information. Through viewing and discussing a variety of graphs, the students will identify 5 components that graphs must contain...
Science Education Resource Center at Carleton College
Serc: Analyzing Greenhouse Gases and Global Temperature Data Over Time
In this activity, students plot data on the concentrations of various greenhouse gases in Earth's atmosphere and look for trends. They will learn that greenhouse gases allow the Sun's light to pass through them to the surface of Earth,...
US Department of Energy
United States Department of Energy: Power Metering Project
Two part instructional activity focuses on applying analytic tools such as pie charts and bar graphs to gain a better understanding of practical energy use issues. Students will learn how different types of data collected affect the...
TeachEngineering
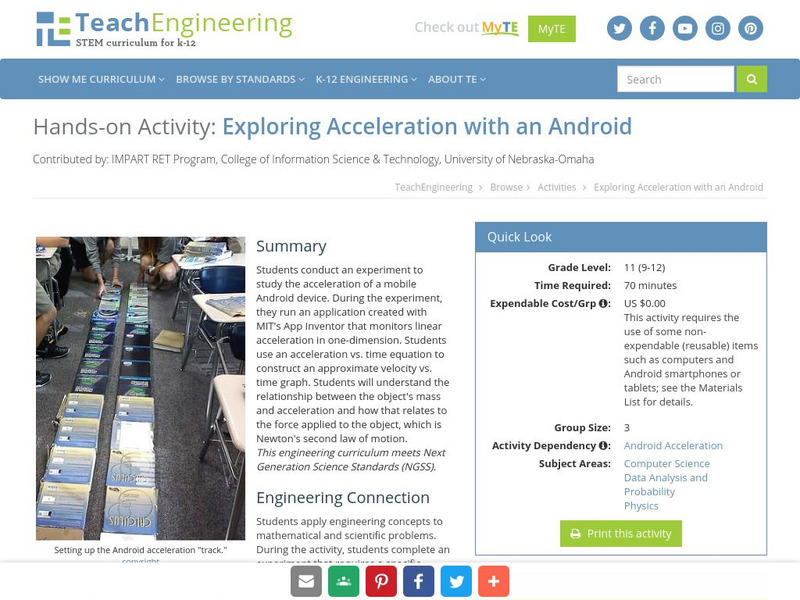
Teach Engineering: Exploring Acceleration With an Android
Students conduct an experiment to study the acceleration of a mobile Android device. During the experiment, they run an application created with MIT's App Inventor that monitors linear acceleration in one-dimension. Students use an...
Center for Innovation in Engineering and Science Education, Stevens Institute of Technology
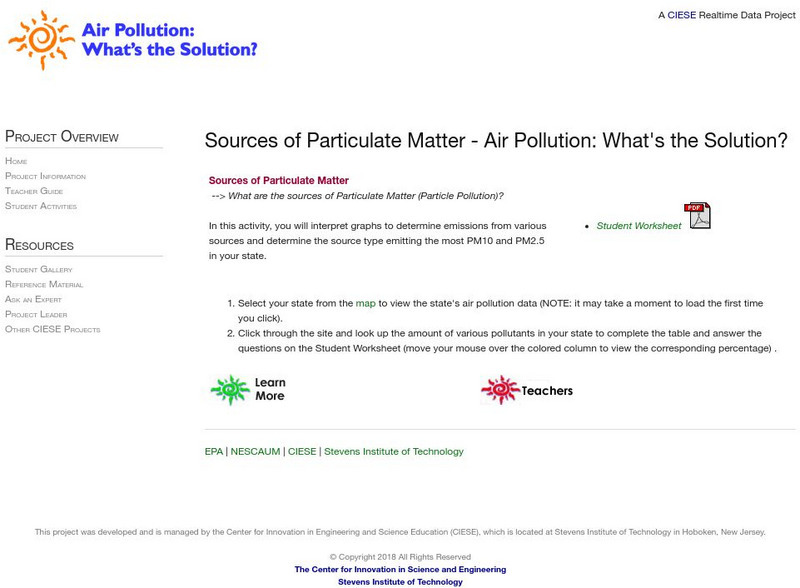
Ciese Real Time Data Projects: Air Pollution: Sources of Particulate Matter
Find out what sources are contributing to the particulate pollution in your state. An interactive bar graph shows the major types of air pollution and their sources. This particular activity focuses on two types of particulates.
Alabama Learning Exchange
Alex: Bloodstain Pattern Doesn't Lie
Students will formulate a hypothesis about the relationship (linear, direct, indirect, etc.) between the distance a drop of blood falls and the diameter of the splatter it makes. To test their hypothesis, the students will work...
Alabama Learning Exchange
Alex: Ice Cream Sundae Survey
Students quickly realize the importance of learning how to read and find information in charts, graphs, and tables compared to finding the same information written in a paragraph. This is a fun, high energy lesson!This lesson plan was...
University of Cambridge
University of Cambridge: Maths and Sports: Olympic Records
Can you work out which Olympics athletics event each anonymised graph of Olympic records data represents? This activity, aimed at Key Stage 3 (age 11-14), gives students the opportunity to make sense of graphical data and challenges them...
University of Cambridge
University of Cambridge: Maths and Sports: Charting Success
Sports statisticians, trainers and competitors create graphs, charts and diagrams to help them to analyse performance, inform training programmes or improve motivation. This activity encourages students to consider and analyse...
University of Cambridge
University of Cambridge: Maths and Sports: Match the Matches
Decide which charts and graphs represent the number of goals two football teams scored in fifteen matches. This data handling activity is designed to get children talking meaningfully about mathematics, presenting and justifying...
Alabama Learning Exchange
Alex: Wheels All Around
Students will use skip counting to see how many wheels visit the school during specified times in one day. This lesson plan was created as a result of the Girls Engaged in Math and Science University, GEMS-U Project.
TeachEngineering
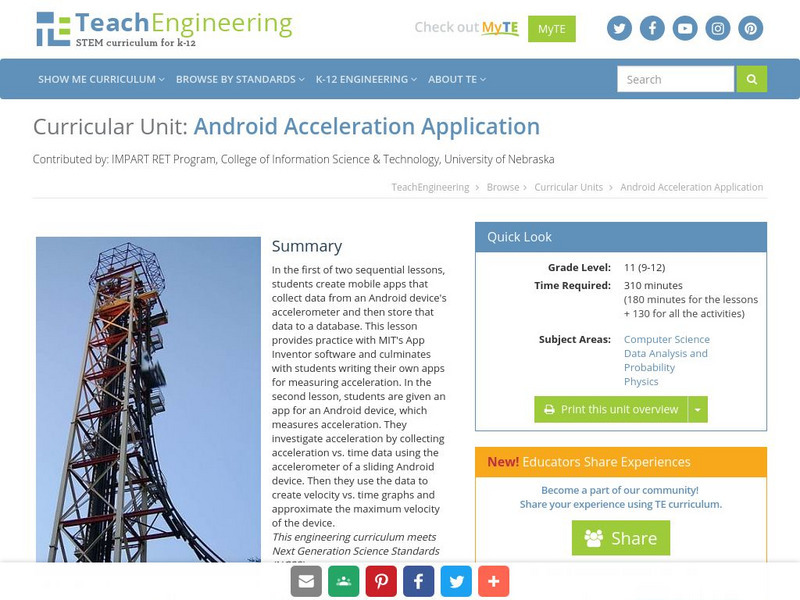
Teach Engineering: Android Acceleration Application
This unit includes two sequential lessons. In the first, students create mobile apps that collect data from an Android device's accelerometer and then store that data to a database. This lesson provides practice with MIT's App Inventor...
TeachEngineering
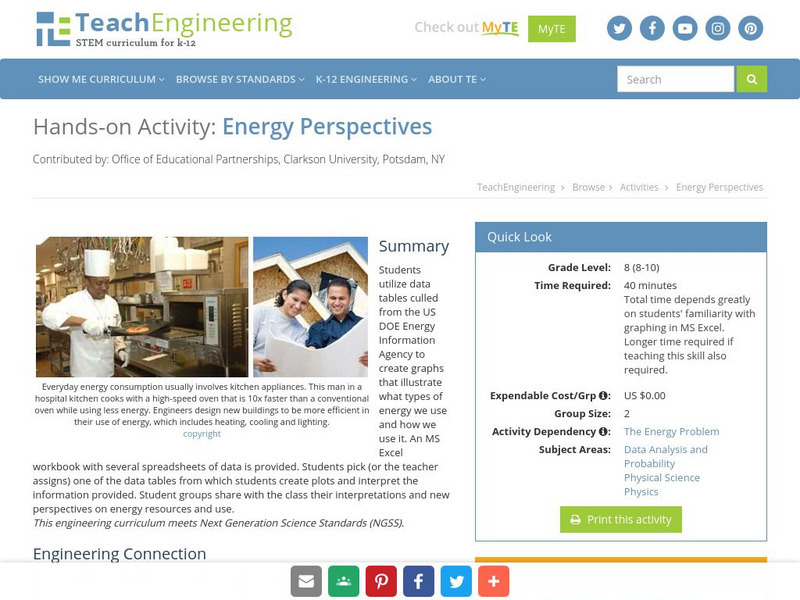
Teach Engineering: Energy Perspectives
Students utilize data tables culled from the US DOE Energy Information Agency to create graphs that illustrate what types of energy we use and how we use it. An MS Excel workbook with several spreadsheets of data is provided. Students...
TeachEngineering
Teach Engineering: Mouse Trap Racing in the Computer Age!
Students design, build and evaluate a spring-powered mouse trap racer. For evaluation, teams equip their racers with an intelligent brick from a LEGO MINDSTORMS NXT Education Base Set and a HiTechnic acceleration sensor. They use...
Concord Consortium
Concord Consortium: Stem Resources: Building a Zip Line
For this interactive, students plan, create, and test a zip line that will transport a hard-boiled egg without breaking it. They will make improvements on their design based on data about its performance. A motion sensor is required in...
TeachEngineering
Teach Engineering: Pointing at Maximum Power for Pv
Student teams measure voltage and current in order to determine the power output of a photovoltaic (PV) panel. They vary the resistance in a simple circuit connected to the panel to demonstrate the effects on voltage, current, and power...


