Curated OER
Graphing Trash Material
Students investigate data and recyclable materials. In this math lesson, students save recyclable materials and create a graph of the materials. Students discuss how they could help the environment by recycling.
Curated OER
Circle Graphs
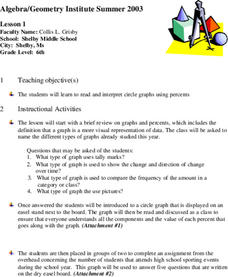
Sixth graders participate in a lesson that covers the reading and interpretation of a circle graph. They review the part of a whole concept for percents and student observe and practice using the circle graph.
Curated OER
Favorite Season Circle Graph
Students create a graph charting their favorite season. They discuss the difference in the four seasons and activities they participate in, in each of the seasons. They can also take a survey of their family members and add them to the...
Curated OER
A Christmas Project
Seventh graders publish a letter and spreadsheet using the computer. They build a three-dimesnsional object with construction paper and develop a Christmas object using coordinates on a graph. Students compose a response in their journals.
Curated OER
Box and Whiskers
Middle schoolers discover how to relate collected data with a box and whiskers graph in a number of formats. They collect, organize, create, and interpret a box and whiskers graph. Pupils interpret the difference between sets of data,...
Curated OER
Hemlock Trees and the Pesky Pest, The Woolly Adelgid
Students review Excel and how to create graphs with this program. They create two graphs in Excel, one showing the average number of woolly adelgid egg sacks on the outer 15 cm of hemlock branch at sites sorted by latitude, then one...
Curated OER
Exploring Wyoming Species Habitats
Students are introduced to the concept of species habitats and ranges. They introduced to ArcView GIS as a tool for mapping. Pupils use query data for species withina county, elevation, range, rivers and streams, land cover, and etc....
Curated OER
Soil Excavation
Students comprehend how percent of change and multipliers are used to determine volume for removal and replacement of soils. They calculate soil volume percent changes using data tables. They apply formulas to solve a variety of...
Curated OER
Race, Education, and Income: Comparing Carter & Reagan
High school learners compare economic outcomes for 3 racial groups under the presidencies of Jimmy Carter and Ronald Reagan by analyzing a series of graphs, answering questions from a worksheet, and participating in a discussion.
Curated OER
Time Management
Young scholars record their daily activities and graph the results using the educational software program called Inspiration. This lesson is intended for the upper-elementary classroom and includes resource links and activity extensions.
Curated OER
Funerals and Burial Rites
Ninth graders research burial practices that originated in West Africa and then migrated to the South Carolina and Ohio. They compare and contrast burial practices in both places. As students collect information and data, they organize...
Science 4 Inquiry
The Ups and Downs of Populations
Life has its ups and downs ... especially if you're an animal! Biology scholars engage in a population study through an inquiry-based instructional activity. Pupils work together to explore the factors that affect deer populations, then...
Polar Trec
Do Microorganisms Live in Antarctica?
Can microorganisms live in the dry, cold climate of Antarctica? Young scientists view a research project measuring microorganisms in the Taylor Glacier. They record the findings from dirty ice, clean ice, boots, sediment, and more. Then...
Berkshire Museum
Reduce, Reuse, and Recycle: Sorting Through Personal Choices
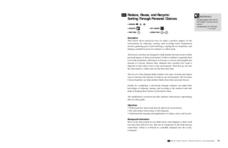
Raise children's awareness about the importance of conservation with this hands-on science lesson plan. Start by breaking the class into groups and having them collect trash from around the school or local park. Students then use the...
Curated OER
Graphs
Students graph ordered pairs to model the relationship between numbers. After observing the patterns in ordered pairs, they describe the relationship, and create graphs from a data table. Students describe intervals in the graph, and...
Curated OER
Bubble Gum Chemistry
Students explore the concept of graphing data. In this graphing data instructional activity, students determine the percentage of sugar in bubble gum. Students graph type of gum vs. sugar percentage. Students create a table of their data.
Curated OER
Heartbeat Project
High schoolers enter information about their heartbeats into a spreadsheet. They construct data displays and calculate statistics. They describe and justify their conclusions from the data collected.
Curated OER
Aerosol Lesson: Science - Graphing SAGE II Data
Students examine and plot atmospheric data on bar graphs.
Bowland
Fashionista
So trendy! Show your class how to identify trends in sales patterns using mathematics. Scholars use a software simulation to collect data on age groups, price, and sales at a fashion store. This data allows individuals to determine the...
Curated OER
Mystery Liquids: Linear Function
High schoolers determine the linear equations of the density of water and oil by collecting data on the mass of various volumes of each liquid. They construct scatter plots from the data and use these to write the linear equations for...
Curated OER
Microsoft Office Excel
Pupils use Microsoft Office Excel. In this technology activity, students enter data on a spreadsheet using Excel. This programs tallies data and presents it using graphs.
Curated OER
Graphing Linear Equations Using Data Tables
Pupils review the Cartesian plane and the process of plotting points. In groups, students create tables, identify the slope and y-intercept, and graph the equation. Afterward, pupils perform the same process, only, individually. As a...
Curated OER
Graphing Changes in Weather
Students graph current temperature and weather conditions for three days. For this weather lesson, students go to the Weather Channel's website and look up weather for their zip code then graph the conditions and record the current...
Curated OER
Peat Pots
Students place a peat pot in water to observe and calculate the rate of capillarity in a model of a soil. This task assesses students' abilities to make simple observations, collect, record, and represent data, use a data table to...


