Curated OER
Snow Cover By Latitude
Students create graphs comparing the amount of snow cover along selected latitudes using data sets from a NASA website. They create a spreadsheet and a bar graph on the computer, and analyze the data.
Curated OER
Particle Motion 2
Students analyze the motion of a particle along a straight line. In this precalculus lesson, students use the TI to analyze the position of a function as they graph and visualise the function. They calculate the distance and...
Curated OER
Destination of Slaves in 1800
In this slave trade worksheet, students use the provided Atlantic Slave Trade statistics to create a pie chart and a bar graph. Students also respond to 4 short answer questions.
Curated OER
Slope as a rate of change
In this Algebra I/Algebra II worksheet, students examine the slope of line as the rate of change between the dependent and independent variables. The one page worksheet contains two multiple choice questions. Answers are...
Curated OER
Geometry Coordinates
In this geometry coordinates instructional activity, students plot given ordered pairs. This one-page instructional activity contains 6 problems.
Curated OER
Graph It
First graders collect classroom data (such as mode of transportation used to get to school) and prepare a pictograph to interpret the information.
Curated OER
The Proof
Young scholars will construct simple curves on graph paper by connecting a series of points between the vertical and horizontal axes. They share their designs and explain the patterns.
Curated OER
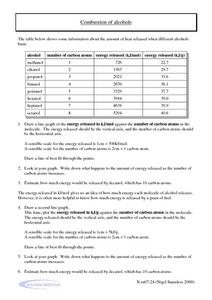
Combustion of Alcohols
In this combustion worksheet, learners use a table showing the amount of heat released when different alcohols burn to complete 2 problems. Students create 2 graphs plotting the energy release against the number of carbon atoms.
Curated OER
Exploring Equations and Y-Intercept
Students graph linear equations using intercepts, find y-intercept, find x-intercepts and graph linear equations that use horizontal and vertical lines.
Curated OER
The Origins and Maintenance of Earth's Atmosphere
In this atmosphere worksheet, students read over a data table showing the percentage of carbon dioxide, oxygen and nitrogen in the atmosphere over the last 4500 million years. Students create a graph comparing these gases over time and...
Curated OER
Race The Rapper: Slopes
Students calculate the slope of the equation In this algebra lesson, students graph coordinate pairs of linear equations and identify the relationship between x and y values and slope. They differentiate between functions and...
Curated OER
Slippery Slope
Students define patterns, relation and function. In this algebra lesson, students find the slope of a line and write equations of line. They model the slope using real life scenarios.
Curated OER
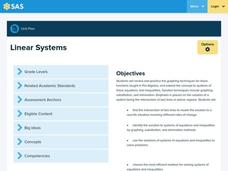
Linear Systems
Students solve and graph linear equations. For this algebra lesson, students solve systems of equations using elimination and substitution. They graph their answer and identify the point of intersection.
Curated OER
Distance in Coordinate Geometry
Students analyze distance and graphing. In this geometry lesson, students work problems on a coordinate grid calculating the distance. They apply the Pythagorean Theorem to their data and answer.
Curated OER
The Doctrine of Signatures
Students use the graphing calculator and the core equation: y=Ax^2+Bx+C where A = the acceleration of gravity/2, B = the initial velocity, and C = initial height above ground to graph parabolas for Earth and Mars. They experiment with...
Curated OER
More Students Taking Online Courses
In this graph worksheet, students study a bar graph that shows the number of college students taking at least one online course. Students answer 4 problem solving questions about the data on the graph.
Curated OER
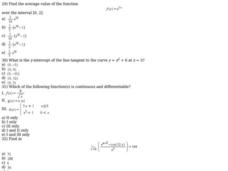
Find the Average Value of a Function
In this calculus worksheet, 11th graders calculate the average value of a function. They find the line tangent to a curve and graph the equation. There are 15 questions.
Curated OER
Parametrics 1
In this parametric worksheet, students sketch given inequalities and use trigonometry functions to eliminate the parameters. They write equations of a line under given parameters. This four-page worksheet contains 11 multi-step problems.
Curated OER
Average Value of a Function
In this calculus worksheet, 12th graders calculate the line tangent to a curve and find the average value of a function. There are 12 questions.
Curated OER
Surface Meteorological Observation System (SMOS)
Students monitor local surface weather conditions for at least 30 days. They interpret the data by graphing it and detemining percentages.
Curated OER
Tally Time
Students create a tally chart. In this math and health lesson, students discuss healthy foods and create a tally chart showing the number of students who like to eat healthy foods.
Curated OER
How Chess Pieces Move
In this how chess pieces move activity, 6th graders read how all of the chess pieces move, then answer one question about the moves of the rook using a grid.
Curated OER
Play Battleship with Coordinates on a Grid
For this play battleship with coordinates on a grid worksheet, students follow directions to mark their ships on their map, then guess where their opponent's ships are on the grid.
Curated OER
The Reciprocal Function Family
In this Algebra II worksheet, 11th graders examine the reciprocal function family in the form y = a/(x – h) + k, identifying the vertical and horizontal asymptotes. The two page worksheet contains explanation, examples, and two...


