Balanced Assessment
Survey Says
Examine statistical data that shows an overlap in responses. The data tallies over 100% and learners interpret this data characteristic. They then create a graph to represent the data.
Curated OER
Line Plot Touchdowns
In this line plots worksheet, students read the number of touchdowns that were scored in Super Bowl Games from 1990-2000. Students use the line plots to answer the questions.
Curated OER
Linear Inequalities
In this algebra worksheet, students solve linear inequalities. They graph their solution on a coordinate plane. There are 6 questions with answer key.
Curated OER
Two Variable Inequalities
In this algebra worksheet, students solve inequalities using addition, subtractions and multiplication. They graph the inequalities with shading. There are 2 questions.
Curated OER
A Country’s Shape Is More Than Its Borders
In this geography skills instructional activity, students read an article and examine graphs about population prior to answering 13 short answer questions and 10 multiple choice questions. Students then respond to the writing prompt...
Curated OER
Graphing Linear Equations
In this math instructional activity, students practice solving systems of linear equations using the elimination and substitution methods. They also graph the solutions.
Curated OER
Inequalities
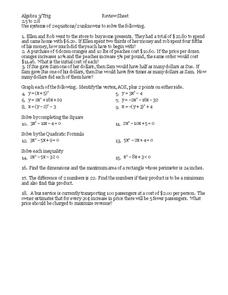
In this inequalities learning exercise, 9th graders solve and complete 18 different types of problems. First, they use systems of 2 equations/2 unknowns to solve each word problem shown. Then, students graph each and identify the vertex...
Curated OER
Solving Systems by Graphing
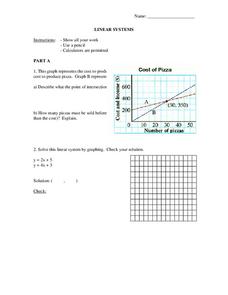
In this Algebra I/Algebra II worksheet, learners solve a system of linear equations by graphing. The one page worksheet contains one problem. Answer is provided.
Curated OER
Conics and Graphing
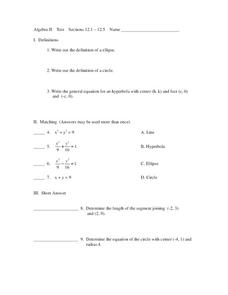
In this algebra worksheet, students solve equations by graphing an ellipse, circle and hyperbola. They match equations to graphs and define each type of function. There are 20 questions total.
Los Angeles County Office of Education
Assessment For The California Mathematics Standards Grade 4
Have scholars show what they know with a 20-page assessment aligned to the California State Standards. The test covers concepts such as large and whole numbers, all four mathematical operations, fractions, decimals, geometric figures,...
Concord Consortium
Betweenness I
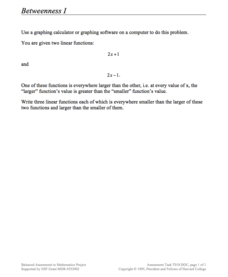
Just between us, this is a pretty cool lesson! Given two functions with the same slope, learners write three new functions whose outputs are all between the given functions. The question is open-ended, allowing pupils to explore the...
Curated OER
Border Patrol ID: 11603
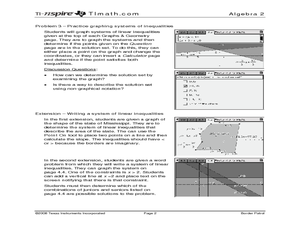
Incorporate technology in your classroom by teaching your students how to graph systems of linear inequalities as they apply to an area of land. The lesson provides an extension in which students are challenged to write a system of...
Curated OER
Leveled Problem Solving: Choosing and Analyzing Data Displays
In this using a bar graph to solve word problems worksheet, students choose and analyze data to problem solve. Students solve six problems.
Curated OER
Describing Trends
In this describing trends worksheet, students read information about broadcast TV plus cable and satellite TV, observe an annual use of the media graph and describe the trends. Students also read a text about advertising, interpret a...
Curated OER
Communicating Data
In this data worksheet, students match information with the best type of graph to display it. Students also make a chart and graph to display information in a given paragraph.
Curated OER
The Konigsberg Bridge Problem
In this Konigsberg Bridge problem learning exercise, high schoolers solve 35 short answer problems. Students construct networks consisting of even and odd vertices. High schoolers make conjectures about the number of odd and even...
Curated OER
Algebra II Test
In this algebra test, learners must determine 3 definitions, match 4 equations to the answer, 4 short answer, and graph 4 points on a coordinate plane. There are 20 questions total.
Curated OER
Easy Worksheet: Limits 2
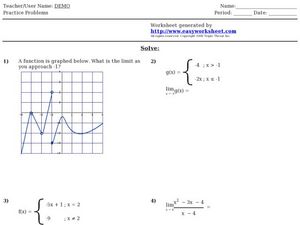
In this limits worksheet, students solve 4 short answer problems. Students identify the limit of a function for a specified value given a graph, equation, or piecewise function.
Curated OER
Final Exam Review: College Algebra
In this final exam review worksheet,s students solve systems of equations, polynomials and factor quadratic equations. They identify the slope of a line and write linear equations. Students use Cramer's rule, graphing, substitution,...
Curated OER
Further Differentiation
In this further differentiation instructional activity, students solve and complete 7 various types of problems. First, they sketch the graph of each equation using a stationary point. Then, students find the stationary points of each...
Curated OER
Exponential Functions
In this exponential functions activity, 9th graders solve and complete 23 various types of problems. First, they simplify each expression. Then, students evaluate the function at different values of x and plot the ordered pairs. in...
Curated OER
Building Towers with Number Cubes
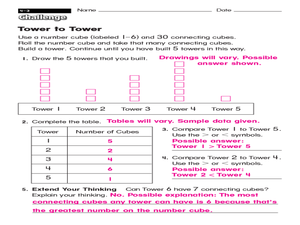
In this building towers with number cubes activity, 2nd graders build number cube towers by rolling a dice, then complete a data chart to compare the number of cubes in each tower.
Curated OER
Set-Builder and Interval Notation
In this set-builder and interval notation worksheet, 9th graders solve and complete 10 different problems that include using set-builder and interval notation to represent an inequality. First, they rewrite the number line shown using...
Curated OER
Evaluating Functions
In this evaluating functions worksheet, 11th graders solve and complete 24 various types of problems. First, they evaluate the functions for the given values. Then, students graph each of piecewise functions. They also write an equation...
Other popular searches
- Inequalities Graphing
- Math Graphing Inequalities
- Inequalities and Graphing
- Algebra Graphing Inequalities


