Mathematics Vision Project
Module 3: Polynomial Functions
An informative module highlights eight polynomial concepts. Learners work with polynomial functions, expressions, and equations through graphing, simplifying, and solving.
Inside Mathematics
Coffee
There are many ways to correlate coffee to life, but in this case a worksheet looks at the price of two different sizes of coffee. It requires interpreting a graph with two unknown variables, in this case the price, and solving for...
Concord Consortium
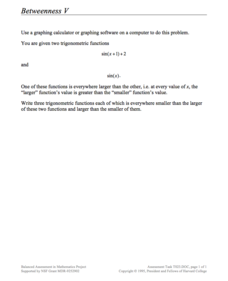
Betweenness V
Take a unique approach to study the graphing of trigonometric functions. Young scholars consider two sine functions and write three functions that will lie between the two given. They use a graphing utility to assist in their explorations.
Concord Consortium
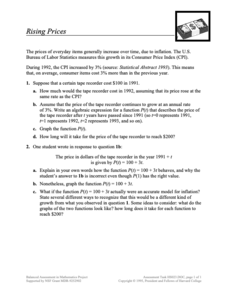
Rising Prices
What will that cost in the future? The scenario provides pupils with a growth as a Consumer Price Index. Learners create functions for a given item to determine future prices and graph them. Class members then compare their functions to...
Benjamin Franklin High School
Saxon Math: Algebra 2 (Section 3)
In this third of a twelve-part series, the focus moves from using matrices to solving systems of equations with substitution and elimination, including more than two dimensions and variables in equations, and analyzing statistical data....
Concord Consortium
Betweenness II
Read between the curves ... quadratic curves! Young scholars analyze the graphs of two quadratic functions by writing their own function whose outputs are between the two given. They then consider intersecting quadratic functions and...
MCAS Mentor
Number Sense and Operations
In this number sense and operations worksheet, learners solve 15 different types of problems that include reading number lines and solving inequalities. First, they write the scientific notation of various numbers given. Then, pupils...
Curated OER
Birds' Eggs
More than just data, scatter plots are full of information that can be used to answer a variety of questions. This lesson uses a plot with information about bird egg sizes to answer questions about the relationship between length and...
EngageNY
Modeling a Context from a Verbal Description (part 1)
When complicated algebraic expressions are involved, it is sometimes easier to use a table or graph to model a context. The exercises in this lesson are designed for business applications and require complex algebraic...
Southwestern Medical Center
Field Epidemiology: Investigation of an Unknown Disease
More than 90 percent of the people in a building have come down with an illness, and it is your job to investigate. Teachers give scientists the data needed to decide what is important and how they can solve the mystery....
Mathematics Assessment Project
Functions
Studying function means more than simply learning a formula. Learners must use functions to think through four problems and find solutions. Each task utilizes a different concept from a study of functions. Class members might...
Polar Trec
Global Snow Cover Changes
Snow is actually translucent, reflecting light off its surface which creates its white appearance. Pairs or individuals access the given website and answer questions about snow cover. They analyze graphs and charts, examine data, and...
University of Colorado
Distance = Rate x Time
Every year, the moon moves 3.8 cm farther from Earth. In the 11th part of 22, classes use the distance formula. They determine the distance to the moon based upon given data and then graph Galileo spacecraft data to determine its movement.
Curated OER
Solving Systems of Inequalities
In this algebra worksheet, students solve systems of inequality using the graphing method. There are 5 questions with lots of examples and an answer key.
Curated OER
Two Step Inequalities
In this algebra learning exercise, 11th graders solve two step algebraic inequalities and graph their solution on a number line. This learning exercise contains 20 graphing problems with an answer key.
Curated OER
Graphing Linear Equations
Ninth graders review the information that they have already learned
with regard to linear equations and graphical representations. They then assist in combining equations with a graphical element and complete various graphs with this...
Curated OER
Absolute Value Inequalities
For this algebra worksheet,students solve inequality equations and graph their answers on a number line. There are 22 questions with an answer key.
Curated OER
Solving Inequalities
In this algebra worksheet, students solve inequality equations and graph them on the number line. There are 22 questions with an answer key.
Curated OER
Worksheet 2.4 Introduction to Inequalities
For this math worksheet, students read the examples that focus upon the concept of inequalities. The examples include the graph of the line.
Curated OER
Bar Graphs and Pie Charts
Students graph data they collected and analyze it using a bar graph. For this algebra lesson, students analyze their data using pie charts and bar graphs while explaining the meaning to each other. They compare and contrast bar...
Curated OER
Graphing Surveys and Analyzing Data
Students analyze data and graph the results of their surveys. In this statistics lesson, students create graphs using excel to make graphs to be able to better observe their data. They conclude how great we as unique individuals.
Curated OER
Object Graphs
Students identify geometric shapes, demonstrate construction of an object graph, compare sets of objects, estimate which student has the most geometric shapes in his or her bag, and play computer game Jump Start Kindergarten.
Curated OER
Chapter 2 Practice Test
In this algebra learning exercise, learners examine and graph linear equation, inequalities, and absolute value inequalities in two variables. The three page learning exercise contains forty-six problems. Answers are not...
Curated OER
Solving Inequalities
In this solving inequalities worksheet, 9th graders solve 15 different inequalities. First, they use the addition, subtraction, multiplication, and division properties of inequalities to solve linear inequalities. Then, students draw a...
Other popular searches
- Inequalities Graphing
- Math Graphing Inequalities
- Inequalities and Graphing
- Algebra Graphing Inequalities


