Statistics Education Web
Saga of Survival (Using Data about Donner Party to Illustrate Descriptive Statistics)
What did gender have to do with the survival rates of the Donner Party? Using comparative box plots, classes compare the ages of the survivors and nonsurvivors. Using the same method, individuals make conclusions about the gender and...
American Statistical Association
Candy Judging
Determine the class favorite. The statistics lesson plan has pupils collect, display, and analyze data. Pairs rank four kinds of candy based on their individual preferences. Working as an entire class, learners determine a way to display...
Mathematics Vision Project
Module 4: Linear and Exponential Functions
Sequences and series are traditionally thought of as topics for the pre-calculus or calculus class, when learners are figuring out how to develop limits. But this unit uses patterns and slopes of linear functions in unique ways to bring...
Curated OER
Deciding Which Type of Graph is Appropriate
In this graphing instructional activity, students read about line, bar, and pie graphs and then determine which graph is the best way to express data results. This instructional activity has 3 short answer questions.
Curated OER
Temperature Bar Graph
Students explore mean, median and mode. In this math lesson, students analyze temperature data and figure the mean, median, and mode of the data. Students graph the data in a bar graph.
Curated OER
Mean, Mode and Bar Graphs
In this mean, mode and bar graphs worksheet, 5th graders analyze the data given, then answer three questions about a bar graph and the data shown.
Curated OER
Pictures of Data: Post Test
In this data worksheet, students answer multiple choice questions about charts and graphs. Students answer 10 questions total.
Curated OER
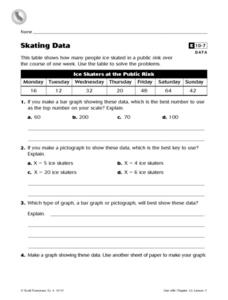
Skating Data
In this collecting data worksheet, 4th graders view a table on ice skaters at a public rink in order to answer 2 multiple choice questions, 1 short answer question and make a graph showing one piece of the data.
Curated OER
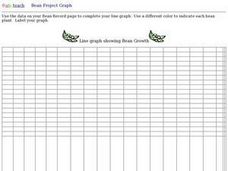
Bean Growth Project Graph Worksheet
In this bean growth project graphing worksheet, student collect data and create a line graph. They use a different color for each line that shows the growth of each bean plant.
Curated OER
Using Data
In this analyzing data worksheet, 4th graders read, study and interpret a bar graph on how many hours Millie spends a week drawing each day. Students answer 2 short answer questions relating to the bar graph.
Curated OER
Data Collection Graph
To be used however fits your needs most, this data collection graph includes spaces to chart a years worth of data. Print, keep handy, and fill out as the target skill is performed.
Curated OER
Interpreting and Displaying Sets of Data
Pupils explore the concept of interpreting data. In this interpreting data lesson, students make a line plot of themselves according to the number of cubes they can hold in their hand. Pupils create their own data to graph and interpret....
Illustrative Mathematics
Robot Races
Analyze data on a graph to answer three questions after a robot race. Learners practice comparing ratios and reading points on a graph. Answers may vary on the last question based on accuracy of graphing. Use the lesson along with three...
Curated OER
Apple Graphing
Do you like apples? Create a taste test for your first and second grade learners. Cut red, green, and yellow apples, and have learners select their favorite. After tasting all of the apples, they collect data and graph the results with...
Curated OER
Make a Frequency Table and a Histogram for a Given Set of Data
In this data recording and data organization worksheet, students create one frequency table and one histogram for a given list of data. Explanations and examples for frequency tables and histograms are given.
Curated OER
Froot Loops to the Max - 2
In this Froot Loops to the max worksheet, middle schoolers complete and solve 5 problems related to a box of Froot Loops cereal. First, they determine how many of each color is represented in the box of Froot Loops. Then, students...
Illustrative Mathematics
Bike Race
A graph not only tells us who won the bike race, but also what happened during the race. Use this resource to help learners understand graphs. The commentary suggests waiting until the end of the year to introduce this topic, but why...
Curated OER
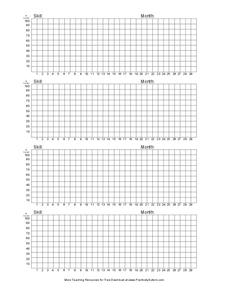
Skills Graph: Template
It doesn't matter what disability your pupil has, if he has an IEP, you'll have to show he has met his goals. Included here is a series of 4 graphs which allow you to chart the skill, month, and percentage correct. I have used of this...
Curated OER
Hand Span and Height
Is there a relationship between hand span width and height? Statisticians survey each other by taking measurements of both. A table that can hold data for 24 individuals is printed onto the worksheet, along with questions for analysis....
Curated OER
Data Handling
In this data handling worksheet, 6th graders solve and complete 4 various types of problems. First, they draw a bar chart to represent the information provided in the table shown. Then, students show beneath the table how to work out the...
Curated OER
Blank Bar Graph -interval of 5
In this blank bar graph worksheet, learners use the grid to display data in a bar graph. The intervals labeled are counting by 5s, from 5 to 50.
Curated OER
Graphs and Spreadsheets
Students collect data and present it in a graph and/or a spreadsheet, depending on their previous understanding of technology.
Curated OER
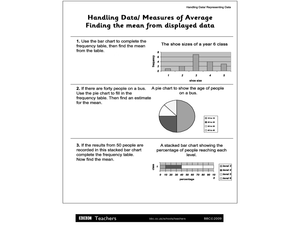
Handling Data/Measures of Average - Finding the Mean from Displayed Data
In this mean and average worksheet, students use the bars and charts to help them find the means using the given data. Students solve 3 problems.
Curated OER
Statistics Canada
Students practice using graphing tools to make tables, bar charts, scatter graphs, and histograms, using census data. They apply the concept of measures of central tendency, examine the effects of outliers. They also write inferences and...


