National Security Agency
Starting a Restaurant
Through an engaging unit, chefs-in-training will sort and classify data using tally charts. Learners will also create bar graphs to display restaurant data and interpret data from bar graphs using a variety of categories. This is a fun...
Inside Mathematics
Population
Population density, it is not all that it is plotted to be. Pupils analyze a scatter plot of population versus area for some of the states in the US. The class members respond to eight questions about the graph, specific points and...
Curated OER
Flicking Football Fun
Young mathematicians fold and flick their way to a deeper understanding of statistics with a fun, hands-on math unit. Over the course of four lessons, students use paper footballs to generate data as they learn how to create line...
Curated OER
Representing Data 1: Using Frequency Graphs
Here is a lesson that focuses on the use of frequency graphs to identify a range of measures and makes sense of data in a real-world context as well as constructing frequency graphs given information about the mean, median, and range of...
ARKive
Handling Data: African Animal Maths
Handling and processing data is a big part of what real scientists do. Provide a way for your learners to explore graphs and data related to the animals that live on the African savannah. They begin their analysis by discussing what they...
Curated OER
Representing Data 2: Using Box Plots
What information can be gleaned from a box and whiskers plot? Discuss the five summary values - minimum, maximum, upper and lower quartiles, and median - and what conclusions can be made from these values? Included here is a matching...
Shmoop
Box, Stem-Leaf, and Histogram
A helpful and versatile worksheet requires young mathematicians to analyze data in order to create graphs and answer questions. Additionally, it prompts learners to find the mean, median, mode, and range of some of the data sets.
Alabama Learning Exchange
Wheels All Around
Budding mathematicians explore the concept of skip counting. They practice skip counting as they use it to determine the number of wheels that come to school at 3 different times throughout the day. They also create a data graph to show...
Los Angeles County Office of Education
Assessment for the California Mathematics Standards Grade 5
Test young mathematicians' knowledge with an assessment aligned to California's fifth grade state standards. The exam covers a multitude of concepts including fractions and decimals, positive and negative numbers, measurement; and how to...
Beyond Benign
The Big Melt: Arctic Ice Caps
Are the Arctic ice caps really melting out of existence? Junior climatologists examine the statistics of ice decline through four math-based lessons. Each activity incorporates data, climate information, and environmental impact into an...
Curated OER
M&M Graphing
Youngsters sort M & M's by color. They graph the M&M's by color on a graph. This classic lesson is a wonderful way to introduce the concept and technique of graphing to young mathematicians. Pairs of kids can make up their own...
NOAA
Climographs
In the second lesson of a five-part series, young climatologists use provided temperature and precipitation data to create climographs of three different cities. They then analyze these climographs to develop a general understanding of...
Teach Engineering
The Challenge Question
A research position becomes a modeling job. The introductory activity in a series of nine presents the challenge of analyzing a set of bivariate data. The class brainstorms what the data may represent. Pupils must decide what is needed...
EngageNY
Modeling a Context from Data (part 1)
While creating models from data, pupils make decisions about precision. Exercises are provided that require linear, quadratic, or exponential models based upon the desired precision.
Learner
Solid Shapes
A collection of two lessons, kindergartners will identify two-dimensional shapes in solid shapes. They will develop basic knowledge of the components that make up a sphere, rectangular prism, pyramid, cylinder, cone, and cube. Young...
Bowland
Mystery Tours – Plan Your Tour
Everyone loves a vacation and a set of three activities has groups planning a tour of the U.K. using given distance, time, and price data. They solve a variety of problems related to the trip and produce a report on the success of the trip.
Teacher's Corner
Brandon's Baseball Collection
Ten questions make up a instructional activity that challenges baseball enthusiasts to read a graph then answer questions pertaining to the data's range, mean, median, and mode.
Curated OER
What's Your Favorite Fruit?
A sweet activity to challenge your first graders! The picture graph displays a class's favorite fruits. Young learners solve various problems with the data, including counting the amounts of each kind of fruit, and interpreting which...
InqueryPhysics
Interpreting Motion Graphs
Every movement in the world can be measured and even motionless objects can be significant indicators of movement. Focus on motion graphs that feature distance vs. time, speed vs. time, and positive and negative acceleration.
Howard Hughes Medical Institute
Scientific Inquiry Using WildCam Gorongosa
How do scientists determine what questions to ask to meet their research goals? Help your class develop an inquiry mindset with a lesson based on studies in the Gorongosa National Park. Partners create their own research questions by...
Curated OER
Number Pairs
As you introduce graphs and coordinate pairs, use this guided activity to get scholars started. They reference an example before recording number pairs to identify the location of 12 letters on a grid. Next, learners examine shapes on a...
National Research Center for Career and Technical Education
Safety and Sanitation
Your microbiologists explore the graphing of exponential growth functions using bacteria, like e. coli and salmonella, in a well-written, career and technology lesson.
Virginia Department of Education
Determining Absolute Age
How can radioactive decay help date old objects? Learners explore half-life and radioactive decay by conducting an experiment using pennies to represent atoms. Young scientists graph data from the experiment to identify radioactive decay...
Curated OER
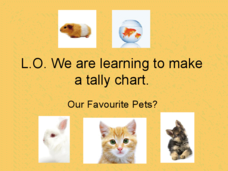
Pet Tally
Give the class an opportunity to practice using tally marks as a way to collect data. As you progress through the slide show, learners tally up the number and types of pets they see, they then use their data to create a tally chart....


