Willow Tree
Line Graphs
Some data just doesn't follow a straight path. Learners use line graphs to represent data that changes over time. They use the graphs to analyze the data and make conclusions.
CK-12 Foundation
Line Graphs to Display Data Over Time: Strawberry Competition
Take the tediousness out of graphing. Using the interactive tool, learners can efficiently create a line graph from a set of data. They then use the graph to answer questions about specific trends in the data.
Curated OER
Describing Data
Your learners will practice many ways of describing data using coordinate algebra in this unit written to address many Common Core State Standards. Simple examples of different ways to organize data are shared and then practice problems...
PBS
Data Plots of Exoplanet Orbital Properties
Scientists discovered the first exoplanet in 1995 and by early 2018, they confirmed the existence of more than 3,700—that's a lot of data! As part of the PBS 9-12 Space series, scholars interpret data about exoplanets. They compare...
CK-12 Foundation
Types of Data Representation: Baby Due Date Histogram
Histograms are likely to give birth to a variety of conclusions. Given the likelihood a woman is to give birth after a certain number of weeks, pupils create a histogram. The scholars use the histogram to analyze the data and answer...
Illustrative Mathematics
Telling a Story With Graphs
Turn your algebra learners into meteorologists. Students are given three graphs that contain information about the weather in Santa Rosa, California during the month of February, 2012. Graph one shows temperatures, graph two displays the...
Curated OER
Position vs. Time Graphs of an Object at Rest
The presentation includes nine time vs. position graphs. The first three are meant to be used for teaching how to read them. The next three provide an opportunity for students to practice reading them, while the last three display the...
Curated OER
Interpreting Position vs. Time Graphs (Still Pretty Basic Stuff)
This is an interactive physics slide show that quizzes viewers about position versus time. It is set up as a series of 10 questions to answer: a graph with a questions slide followed by an answer slide. This is terrific practice in graph...
Curated OER
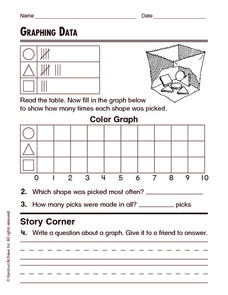
Graphing Data
For this graphing data worksheet, learners solve and complete 8 different word problems related to graphing data given. First, they determine the percent of people who do not believe in any of the phenomena described and explain. Then,...
Curated OER
Math Word Problems: Reading Bar Graphs
For this math word problems-reading bar graphs worksheet, students analyze the bar graph and answer six questions about the data in the graph.
Curated OER
Experiment Report (Normal Form)
Here is a handy handout to give any science class as a guide to writing lab reports. It is a blank outline that you can have aspiring scientists fill out when they experiment, or imitate as they record their experiments in a lab journal....
Heidi Songs
Zoo Animal Probability Graph
Capture the engagement of your young mathematicians with a collaborative graphing activity. Using a deck of zoo animal picture cards, students select a picture from the deck, record the chosen animal on a graph,...
Chicago Botanic Garden
Plant Phenology Data Analysis
Scientists monitor seasonal changes in plants to better understand their responses to climate change, in turn allowing them to make predictions regarding the future. The last activity in the series of six has scholars analyze BudBurst...
K12 Reader
Showing Data on a Graph
Here's a worksheet that not only introduces kids to graphing, but also is designed as a reading comprehension activity. After reading the article about graphing, kids respond to a series of questions based on the article.
US Department of Commerce
Looking at Numbers of Births Using a Line Graph
Was there a baby boom? Using census data, class members take a look at the number of 8-11 year olds and determine their birth years. Scholars create a double line graph to compare the number of births for two states for several years....
Virginia Department of Education
Graphs
Examine different types of graphs as a means for analyzing data. Math scholars identify the type of graph from a series of data displays and then develop questions to match each one. Then, given a scatter plot of height versus age...
Fort Bend Independent School District
Data Analysis - AP Statistics
What better way to study survey design than to design your own survey! Bring a versatile data analysis project to your AP Statistics class, and encourage them to apply the practices from their instructions to a real-world survey...
Shodor Education Foundation
Multi-Function Data Flyer
Explore different types of functions using an interactive lesson. Learners enter functions and view the accompanying graphs. They can choose to show key features or adjust the scale of the graph.
Shodor Education Foundation
Data Flyer
Fit functions to data by using an interactive app. Individuals plot a scatter plot and then fit lines of best fit and regression curves to the data. The use of an app gives learners the opportunity to try out different functions to see...
Inside Mathematics
Vencent's Graphs
I like algebra, but graphing is where I draw the line! Worksheet includes three multiple-part questions on interpreting and drawing line graphs. It focuses on the abstract where neither axis has numbers written in, though both are...
Pace University
Grade 7 Earth Day Statistics with Circle and Bar Graphs
Take a tiered approach to studying waste. The lesson uses Earth Day to present differentiated instruction around using circle and bar graphs. Each group gets a cube based on their tiers and works collaboratively as well as individually...
Mathematics Vision Project
Module 9: Modeling Data
How many different ways can you model data? Scholars learn several in the final module in a series of nine. Learners model data with dot plots, box plots, histograms, and scatter plots. They also analyze the data based on the data...
Statistics Education Web
First Day Statistics Activity—Grouping Qualitative Data
Making groups of groups can help to organize data. Classes use statistics to group themselves using descriptive adjectives. The objective is for learners to understand that grouping qualitative data is useful when the original groups are...
Teach Engineering
Graphing Equations on the Cartesian Plane: Slope
Slopes are not just for skiing. Instructors introduce class members to the concept of slope and teach them how to calculate the slope from a graph or from points. The lesson also includes the discussion of slopes of parallel and...


