Curated OER
Basketball Bounces, Assessment Variation 1
This highly scaffolded, summative assessment tasks learners to choose the model that represents the height of a bouncing basketball given the data in graph and table form. Learners then use the model to answer questions about the...
Del Mar College
Algebra Assessment Review
Take the time out of preparing an algebra review and use this multiple-choice assessment to prep for the big test. Some included topics are factoring, FOILing, inequalities, and linear graphs.
Curated OER
Inequalities are Everywhere
In this Algebra I activity, 9th graders work with a family member to graph inequalities on a number line. The two page activity contains five questions. Answers are included.
Curated OER
Slopes of Lines
Students examine a graph and relate it to the real world situation it depicts. They investigate changes in an equation and the appearance of a line. They investigate the connection between the graph of a situation and the meaning of the...
Curated OER
Which Method Will You Choose? Finding Solutions to Systems of Equations.
Ninth graders investigate systems of linear equations. In this Algebra I lesson, 9th graders determine which method is the best for solving a systems: graphing, substitution, or elimination. Students choose a method and create a...
Curated OER
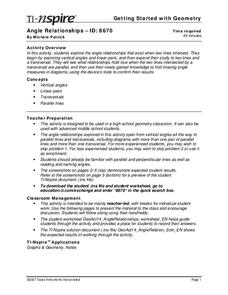
Angle Relationships
Tenth graders explore the angle relationships that exist when two lines intersect. In this geometry lesson, 10th graders estimate the measure of given angles and use their graphing calculator tools. Students use this knowledge to find...
Curated OER
Algebra 2 Test
In this algebra worksheet, students solve problems by graphing inequalities, finding the slope of a line and identifying functions. This is a review of chapter 2 on an algebra test. There are 21 questions.
Curated OER
Residential Power System
Perform data analysis on energy consumption to apply algebraic expressions to the real world. Learners will write and solve equations that answer various questions from residential power use. They will collect data at home and calculate...
5280 Math
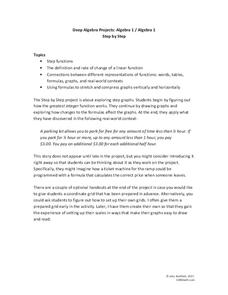
Step by Step
One step at a time! A seemingly linear relationship becomes an entirely new type of function. Young scholars build their understanding of step functions by completing a three-stage activity that incorporates multiple representations of...
Virginia Department of Education
Road Trip
Help plan a road trip with linear equations. Scholars consider two different rental car companies and write equations representing the cost for each company. They graph the system of equations to determine the conditions under which each...
Inside Mathematics
Coffee
There are many ways to correlate coffee to life, but in this case a worksheet looks at the price of two different sizes of coffee. It requires interpreting a graph with two unknown variables, in this case the price, and solving for those...
Concord Consortium
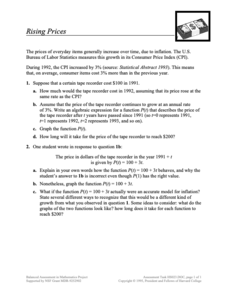
Rising Prices
What will that cost in the future? The scenario provides pupils with a growth as a Consumer Price Index. Learners create functions for a given item to determine future prices and graph them. Class members then compare their functions to...
EngageNY
Solution Sets to Simultaneous Equations (part 1)
How are systems related? Build on your pupils' previous knowledge of solving systems of equations by introducing systems of inequalities. Learners explore similarities between systems of equations and inequalities to make a strong...
Noyce Foundation
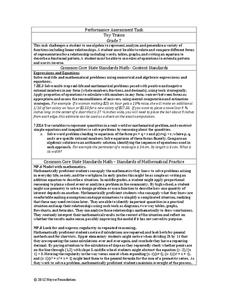
Toy Trains
Scholars identify and continue the numerical pattern for the number of wheels on a train. Using the established pattern and its inverse, they determine whether a number of wheels is possible. Pupils finish by developing an algebraic...
Concord Consortium
Betweenness II
Read between the curves ... quadratic curves! Young scholars analyze the graphs of two quadratic functions by writing their own function whose outputs are between the two given. They then consider intersecting quadratic functions and...
Curated OER
Birds' Eggs
More than just data, scatter plots are full of information that can be used to answer a variety of questions. This lesson uses a plot with information about bird egg sizes to answer questions about the relationship between length and...
Curated OER
Linear Motion 5
In this linear motion worksheet, high schoolers answer 9 questions about velocity, acceleration and position of objects. They solve problems for acceleration and velocity and they interpret graphs of velocity vs. time, acceleration vs....
Curated OER
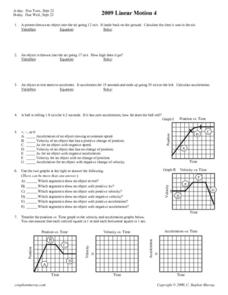
Linear Motion 4
In this linear motion worksheet, high schoolers answer 12 questions including finding acceleration of moving objects, calculating distance objects travel and determining the time of travel. Students interpret graphs of position vs. time,...
Curated OER
Linear Equations
In this algebra worksheet, 11th graders solve linear equations and rewrite them in the form y=mx + b. They graph the equations using the slope and y-intercept. There are 22 questions with an answer key.
Curated OER
Systems of Linear Equations
In this systems of equations worksheet, high schoolers complete 14 multiple choice questions involving systems of equations and finding how many solutions belong to a set of systems.
EngageNY
Polynomial, Rational, and Radical Relationships
This assessment pair goes way beyond simple graphing, factoring and solving polynomial equations, really forcing learners to investigate the math ideas behind the calculations. Short and to-the-point questions build on one another,...
Inside Mathematics
Population
Population density, it is not all that it is plotted to be. Pupils analyze a scatter plot of population versus area for some of the states in the US. The class members respond to eight questions about the graph, specific points and...
Flipped Math
Unit 3 Review: Systems of Equations
More practice makes perfect. A review packet helps pupils remind themselves of the content of the unit. They determine whether points are solutions to linear equations, graph systems of equations and inequalities, and solve systems of...
American Statistical Association
Scatter It! (Predict Billy’s Height)
How do doctors predict a child's future height? Scholars use one case study to determine the height of a child two years into the future. They graph the given data, determine the line of best fit, and use that to estimate the height in...


