Rice University
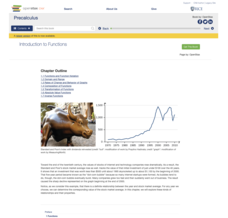
Precalculus
Take a step beyond Algebra 2. Learners use the eBook to learn concepts from the typical Precalculus course. Content starts off with a short review of functions in general and moves on to the basic functions, finishing up with more...
Statistics Education Web
Text Messaging is Time Consuming! What Gives?
The more you text, the less you study. Have classes test this hypothesis or another question related to text messages. Using real data, learners use technology to create a scatter plot and calculate a regression line. They create a dot...
Curated OER
How Texas is Planning To Manage Its Water
Students research water management strategies in Texas. They analyze projected demand for water in the year 2050, interpret graphs and tables and then discuss the data as part of a written report. They research and map the locations of...
Curated OER
Slope
Students calculate the slope of a line. In this slope lesson, students use a graph, an equation or two points to help them calculate the slope of a line. They differentiate between a slope of zero and an undefined slope.
Curated OER
Walking Home II
Young scholars explore the relationship between distance and time. They analyze a situation involving distance traveled in a given period of time, represent the situation graphically and algebraically, and discuss the concept of slope as...
Curated OER
The Window Problem
Students identify patterns and compute formulas to solve the problems. In this algebra activity, students come up with a rule given a pattern, and analyze the relationship between data and graphs.
Texas Instruments
A Tale of Two Lines
Students graph systems of equation. In this calculus instructional activity, students graph their lines on a TI calculator. They identify the point of intersection and the type of solution.
Curated OER
Calculator-Based Lessons Help Examine Real-World Data
Students may determine equations based on graphs and regression models.
Curated OER
Giant Mystery
Third graders determine the relationship between hand size and body size using centimeters as the unit of measure, They use the relationship to find the size of a hypothetical giant. They graph the measurements using a spreadsheet program.
Curated OER
Polly and the Shapeshifter
Students analyze the patterns in polygons and relate it to the rate of change. In this algebra lesson, students discuss the relationship between the data and the graph of the data.
Curated OER
Who Shares my Functions?
Learners examine the relationship between two equations. In this algebra lesson, students investigate linear and non-linear relationships between two equations. They discuss functions of graphs, tables and equations by making posters.
American Statistical Association
You and Michael
Investigate the relationship between height and arm span. Young statisticians measure the heights and arm spans of each class member and create a scatter plot using the data. They draw a line of best fit and use its slope to explain the...
Curated OER
Cartesian Coordinate System
Students explore the Cartesian coordinate plane and plot points on the graph. They interpret coordinates for a point from the graph and give the ratio of rise over run for slope.
Curated OER
What's The Point?
Students solve word problems using the correct math symbols. In this algebra lesson, students use the TI calculator to graph their equation and analyze it. They find the line of regression and use to draw conclusion.
Curated OER
Height of Bounce
Eighth graders determine the relationship between the height of bounce of a ping-pong ball and the height from which it was dropped. They are assessed on the ability to record and interpret data, graph data, make predictions, and make...
Curated OER
Saving Money Through Mathematics
Third graders discuss light sources and collect data about energy sources. They compare data and create a multiple line graph showing energy used by light sources for each student in the group. They present their graphs and write a...
Curated OER
Graphs and Functions
Students are introduced to plotting functions on the Cartesian coordinate plane seen several categories of functions, including lines and parabolas
Curated OER
Direct and Inverse Variation
Eighth graders participate in two data collection activities that involve direct and inverse variation. In the pre-assessment, 8th graders categorize numerical, graphical, and verbal representations as linear or nonlinear and determine...
Curated OER
Discovering Growth Patterns
Students explain the differences between linear (arithmetic) and exponential (geometric) growth. They use worksheets imbedded in this lesson to help them make predicitions and graph data points.
Curated OER
Water in the Texas Coastal Basins
Students, after researching a Texas coastal basin, map and graph the information they collect and then translate it into a short report to be presented to their classmates. They brainstorm unique ways to maintain Texas estuaries as well...
Curated OER
The Quadratic Formula
Students solve quadratic function by completing the square. For this algebra lesson, students use the quadratic formula to factor quadratics and find the roots. They graph the parabola and identify its properties.
Curated OER
WORLD POPULATION STUDY
Students explore an exponential relationship and how it relates to human population growth and the current global population crisis.
Curated OER
The Absolute Truth
Students solve problems of inequalities and equations. In this algebra lesson, students add, subtract, multiply and divide to solve inequalities. They graph their solutions on a number line.
Curated OER
Investing
Students collect data on investments and draw conclusions. In this algebra lesson, students analyze exponential graphs as they relate to money. They discuss the cause of an account balance being high or low.


