Curated OER
Linear Equations
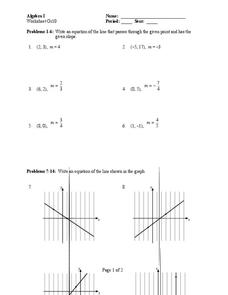
In this Algebra I activity, 9th graders write the equation of a line given a point and the slope and write the equation given a graph. The two page activity contains fourteen problems. Answers are not provided.
Curated OER
Systems of Linear Equations Modeling!
High schoolers focus on finding solutions to situations found in everyday life. Students participate in activities to solve a system of equations, identify the system as consistent and independent, consistent and dependent or...
Curated OER
Algebra 1, Unit 7, Lesson 8: Practice Finding the Equation of a Line
Learners solve systems of linear equations by graphing. The introduction of the activity asks students to work in pairs or small groups to graph a line when given two points. Learners graph 14 equations on the same coordinate grid to...
Curated OER
Exploring Linear Equations
Third graders use graphing calculators to graph equations. They make visual models of algebraic expressions and they can readily see that an equation represents something.
Curated OER
Systems of Linear Equations
In this systems of equations instructional activity, students complete 14 multiple choice questions involving systems of equations and finding how many solutions belong to a set of systems.
Curated OER
Linear Equations
In this Algebra II worksheet, 11th graders write the equation of a line given a table, the slope and a point, or two points. The three page worksheet contains eleven problems. Answers are not provided.
Illustrative Mathematics
Two Lines
Here is a resource that helps your algebra learners understand the connection between the graph of two lines, the equations of lines, and the solutions and intersecting points of lines. It would make a great assessment question, but can...
Curated OER
Worksheet 1 - Equation of a Line
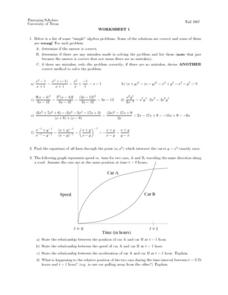
In this equation of a line worksheet, students determine the equation of a line, use the distance formula to identify the relationship between two moving objects, and solve inequalities algebraically. This two-page worksheet contains...
Curated OER
Do These Systems Meet Your Expectations
This lesson is all about systems of equations and their graphs. Algebra learners create and solve systems of equation using tables and graphing. They identify the point of intersection of a system of equation, and discover what the...
National Security Agency
Systems of Equations and Inequalities
High school classes can use manipulatives too! Offer hands-on, interactive lessons that venture away from the typical day in your algebra class. Young mathematicians will be involved in collaborative learning, visual...
Charleston School District
Review Unit 6: Systems of Equations
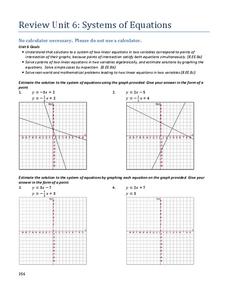
It's time to show off what they learned! The final lesson in the series is a review worksheet on the topics learned throughout the unit. Scholars solve systems of equations using graphic and algebraic methods, solve system-based word...
Concord Consortium
Function Project
What if a coordinate plane becomes a slope-intercept plane? What does the graph of a linear function look like? Learners explore these questions by graphing the y-intercept of a linear equation as a function of its slope. The result is a...
EngageNY
Linear and Exponential Models—Comparing Growth Rates
Does a linear or exponential model fit the data better? Guide your class through an exploration to answer this question. Pupils create an exponential and linear model for a data set and draw conclusions, based on predictions and the...
EngageNY
Analyzing a Graph
Collaborative groups utilize their knowledge of parent functions and transformations to determine the equations associated with graphs. The graph is then related to the scenario it represents.
Curated OER
Matchstick Math: Using Manipulatives to Model Linear, Quadratic, and Exponential Functions
Playing with matches (unlit, of course) becomes an engaging learning experience in this fun instructional unit. Teach pupils how to apply properties of exponential functions to solve problems. They differentiate between quadratic and...
Curated OER
Quick Graphs of Linear Equations
Graph equations of lines using the slope-intercept method or by plotting both x and y intercepts. Determine if two lines are parallel or perpendicular by comparing their slopes. This handout includes step-by-step directions and four...
Curated OER
Linear Programming
In this algebra worksheet, students calculate the maximum and minimum of a shaded region. They identify the boundaries and their vertices's. There are 2 problems.
EngageNY
Graphing Quadratic Functions from Factored Form
How do you graph a quadratic function efficiently? Explore graphing quadratic functions by writing in intercept form with a lesson that makes a strong connection to the symmetry of the graph and its key features before individuals write...
EngageNY
Exploring the Symmetry in Graphs of Quadratic Functions
Math is all about finding solutions and connections you didn't expect! Young mathematicians often first discover nonlinear patterns when graphing quadratic functions. The lesson begins with the vocabulary of a quadratic graph and uses...
Curated OER
Linear and Quadratic System
Learners find the common point of a linear and quadratic system given a graph of the system. Then they find a specific point located only on the parabola.
Curated OER
Review for the Final Exam - College Prep Algebra
In this algebra review worksheet, students solve 100 open-ended and multiple choice problems. Students factor, simplify, graph, and solve inequalities, expressions, and equations.
West Contra Costa Unified School District
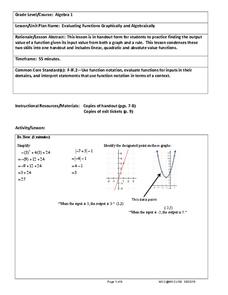
Evaluating Functions Graphically and Algebraically
High schoolers evaluate functions graphically and algebraically. After completing that step, they write a statement describing the input and output.
Teach Engineering
Graphing Equations on the Cartesian Plane: Slope
Slopes are not just for skiing. Instructors introduce class members to the concept of slope and teach them how to calculate the slope from a graph or from points. The lesson also includes the discussion of slopes of parallel and...
EngageNY
Lines That Pass Through Regions
Good things happen when algebra and geometry get together! Continue the exploration of coordinate geometry in the third lesson plan in the series. Pupils explore linear equations and describe the points of intersection with a given...


