Inside Mathematics
Functions
A function is like a machine that has an input and an output. Challenge scholars to look at the eight given points and determine the two functions that would fit four of the points each — one is linear and the other non-linear. The...
Virginia Department of Education
Inequalities
Compare graphing an inequality in one variable on a number line to graphing an inequality in two variables on a coordinate plane. Young mathematicians work on a puzzle matching inequalities and their solutions. They then complete a...
Inside Mathematics
Coffee
There are many ways to correlate coffee to life, but in this case a worksheet looks at the price of two different sizes of coffee. It requires interpreting a graph with two unknown variables, in this case the price, and solving for...
Inside Mathematics
Quadratic (2009)
Functions require an input in order to get an output, which explains why the answer always has at least two parts. After only three multi-part questions, the teacher can analyze pupils' strengths and weaknesses when it comes to...
Curated OER
Dental Impressions
What an impressive task it is to make dental impressions! Pupils learn how dentists use proportional reasoning, unit conversions, and systems of equations to estimate the materials needed to make stone models of dental impressions....
Curated OER
Integration: Geometry, Parallel and Perpendicular Lines
In this math worksheet, students write linear equations in slope-intercept form that passes through the given point. On the last 8 equations, students write the equation of the perpendicular line.
Curated OER
Derivatives
In this derivatives instructional activity, 11th graders solve and complete 2 various types of problems. First, they use the definition of a derivative to find the variable expression shown for each function. Then, students write the...
Curated OER
Graphs Involving Absolute Value
In this Algebra I/Algebra II instructional activity, students graph absolute value functions. The two page instructional activity contains four multiple choice questions. Answers are included.
Concord Consortium
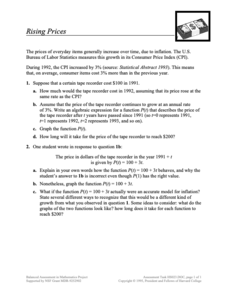
Rising Prices
What will that cost in the future? The scenario provides pupils with a growth as a Consumer Price Index. Learners create functions for a given item to determine future prices and graph them. Class members then compare their functions to...
Chicago Teachers Union Quest Center
Factored Form of a Quadratic Function
Build upon linear functions to learn about quadratics. The lesson introduces the concept of zeros for quadratic functions and makes the connection to the linear factors of the function. It presents quadratics in both graphical and...
MARS, Shell Center, University of Nottingham
Defining Regions Using Inequalities
Your young graphers will collaboratively play their way to a better understanding of the solution set produced by the combining of inequalities. Cooperation and communication are emphasized by the teacher asking questions to guide the...
Curated OER
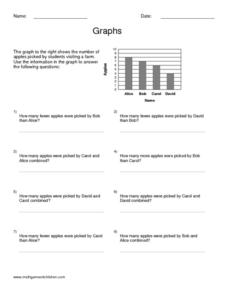
Graphs
In this algebra worksheet, students calculate the point of intersection between a circle and a straight line. There are 5 questions with an answer key.
Curated OER
Point of Intersection
In this algebra learning exercise, students graph two linear equations identifying where they cross and how many solutions there are. There are 4 questions with an answer key.
Lane Community College
Review Sheets: Geometry
Full of problems with polygons, angles, lines, and triangles, your learners get a multi-page packet that provides all they need to know. It contains many of the standard problem types as well as some more challenging questions.
Curated OER
Slope of Line
In this algebra worksheet, students calculate the slope of a line. They graph a linear equation given the slope and y-intercept and identify the slope and y-intercept given a linear graph. There are 15 questions.
Inside Mathematics
Population
Population density, it is not all that it is plotted to be. Pupils analyze a scatter plot of population versus area for some of the states in the US. The class members respond to eight questions about the graph, specific points and...
EngageNY
Analyzing a Data Set
Through discussions and journaling, classmates determine methods to associate types of functions with data presented in a table. Small groups then work with examples and exercises to refine their methods and find functions that work...
Curated OER
Pairs of Lines Multiple Choice
In this algebra worksheet, students identify the slope and y intercept of lines. They compare the slope of perpendicular and parallel lines and find the missing slope. There are 6 questions with an answer key.
Virginia Department of Education
Factoring for Zeros
Relate factors to zeros and x-intercepts. Scholars first graph quadratics in both standard and factored forms to see that they are the same. They go on to use the graphs to see the relationship between factors and x-intercepts.
Inside Mathematics
Conference Tables
Pupils analyze a pattern of conference tables to determine the number of tables needed and the number of people that can be seated for a given size. Individuals develop general formulas for the two growing number patterns and...
Illustrative Mathematics
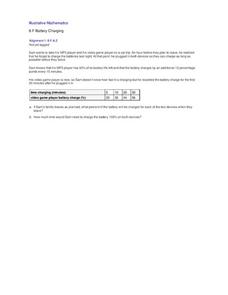
Battery Charging
Your class will be very interested in the results of this activity. How long does it take a MP3 and video game player to charge? Sam only has an hour and the MP3 player only has 40% of its battery life left. Plus, his video player...
EngageNY
Mid-Module Assessment Task: Grade 7 Mathematics Module 4
Assess the ability of the class to solve percent problems with an assessment that covers a variety of percent problems from basic to multi-step. Pupils make connections between percent problems and proportional thinking to complete...
Curated OER
Graphing Solution of a Quadratic and Linear System
In this algebra learning exercise, students identify the systems of equation as quadratics or linear. They graph their solutions. There are 4 questions with an answer key.
Curated OER
Algebraic Solution of a Quadratic, Linear System
In this algebra worksheet, students solve systems of equations using linear and quadratics. They graph their solutions on a coordinate plane. There are 5 questions with an answer key.


