Curated OER
Graphs Involving Absolute Value
In this Algebra I/Algebra II instructional activity, students graph absolute value functions. The two page instructional activity contains four multiple choice questions. Answers are included.
Curated OER
Connecting Factors and Zeros
In this Algebra II lesson plan, students explore the connection between the factored form of a quadratics and the zero of a function. Students use a graphing calculator to verify factoring numerically and graphically.
Texas Instruments
A Tale of Two Lines
Students graph systems of equation. In this calculus lesson, students graph their lines on a TI calculator. They identify the point of intersection and the type of solution.
Curated OER
The Kangaroo Conundrum: A Study of a Quadratic Function
Students play a game and collect data for their graph. For this algebra lesson, students solve quadratic equations and identify properties of their graph. They describe the pattern created by the graph and the game.
Mathematics Vision Project
Module 3: Polynomial Functions
An informative module highlights eight polynomial concepts. Learners work with polynomial functions, expressions, and equations through graphing, simplifying, and solving.
EngageNY
End-of-Module Assessment Task - Algebra 1 (Module 4)
Critical thinking is an important aspect of mathematics — it's time to put your brain to work! Use this assessment to challenge pupils and test their skills. Concepts assessed include function notation, factoring, completing the square,...
Concord Consortium
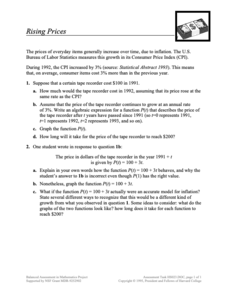
Rising Prices
What will that cost in the future? The scenario provides pupils with a growth as a Consumer Price Index. Learners create functions for a given item to determine future prices and graph them. Class members then compare their functions to...
Chicago Teachers Union Quest Center
Factored Form of a Quadratic Function
Build upon linear functions to learn about quadratics. The lesson introduces the concept of zeros for quadratic functions and makes the connection to the linear factors of the function. It presents quadratics in both graphical and...
Mathematics Vision Project
Module 3: Features of Functions
Learn how to represent functions in multiple ways. Learners analyze functions as equations, graphs, and verbal descriptions. The analysis includes intercepts, behavior, domain, and range. The module of seven lessons makes up the third...
MARS, Shell Center, University of Nottingham
Defining Regions Using Inequalities
Your young graphers will collaboratively play their way to a better understanding of the solution set produced by the combining of inequalities. Cooperation and communication are emphasized by the teacher asking questions to guide the...
Curated OER
Graphing and the Coordinate Plane
Students examine the four quadrants of Cartesian coordinate plane. They play maze games and coordinate games to discover how to read and plot points on the plane. Students plot points on the coordinate plane and examine the ratio of...
Curated OER
Systems of Linear Inequalities 2
Students solve systems of inequalities. In this lesson plan, they identify the solution of the two lines and shade the solution. They identify the boundary line and the region representing the solution.
Curated OER
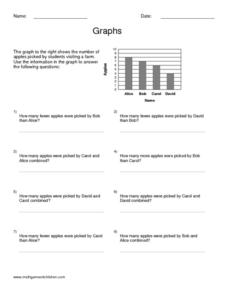
Graphs
In this algebra worksheet, students calculate the point of intersection between a circle and a straight line. There are 5 questions with an answer key.
Curated OER
Point of Intersection
In this algebra learning exercise, students graph two linear equations identifying where they cross and how many solutions there are. There are 4 questions with an answer key.
Alabama Learning Exchange
Systems on a Mission
Solve systems of equation problems using four different methods: elimination by addition or subtraction, graphing, elimination by multiplication, and substitution. Middle schoolers are then given a series of "missions" to complete.
West Contra Costa Unified School District
Standard Form of Conics
Looking for a complete go-to guide for the standard form of conics? This five-page packet does a nice job of connecting conics to prior knowledge of functions and transformations. Adapt the resource as Algebra II lesson plan...
Lane Community College
Review Sheets: Geometry
Full of problems with polygons, angles, lines, and triangles, your learners get a multi-page packet that provides all they need to know. It contains many of the standard problem types as well as some more challenging questions.
Curated OER
Whose Line is it Anyway?
Learners solve systems of equations. In this algebra lesson, students identify the domain and range of each function. They use the slope and y-intercept to graph each line.
Curated OER
Round and Round and Round We Go!
Students investigate motion using a CBL. In this algebra lesson plan, students collect and graph data on a coordinate plane. They define and identify amplitude and period of conic graphs.
Curated OER
Walking on Air
Students collect and analyze data with a graph. In this statistics lesson, students use central tendencies to find the meaning of their data. They display the data on a Ti calculator.
Curated OER
Systems of Linear Inequalities in Slope-Intercept Form -- Lecture
Students are introduced to linear inequalities in slope-intercept form. As a class, they participate when needed in a demonstration given by their teacher and practice graphing inequalities and describing the solution. They set up and...
Curated OER
Slope of Line
In this algebra worksheet, students calculate the slope of a line. They graph a linear equation given the slope and y-intercept and identify the slope and y-intercept given a linear graph. There are 15 questions.
Curated OER
Convert Standard Form to Slope-Intercept Form
Ninth graders convert between the standard form of an equation and the y-intercept form. In this algebra lesson, 9th graders rewrite equations from their standard form into the y=mx + b form. They solve for y using the distributive...


