Curated OER
Pairs of Lines Multiple Choice
In this algebra activity, students identify the slope and y intercept of lines. They compare the slope of perpendicular and parallel lines and find the missing slope. There are 6 questions with an answer key.
Curated OER
Write the Equation of a Line Given the Slope and a Point
Young scholars write the equation of a line given the slope and y-intercept. In this algebra lesson, students are given a point a the line and the slope of the line and are asked to write an equation of the line. They relate lines to...
Virginia Department of Education
Factoring for Zeros
Relate factors to zeros and x-intercepts. Scholars first graph quadratics in both standard and factored forms to see that they are the same. They go on to use the graphs to see the relationship between factors and x-intercepts.
Inside Mathematics
Conference Tables
Pupils analyze a pattern of conference tables to determine the number of tables needed and the number of people that can be seated for a given size. Individuals develop general formulas for the two growing number patterns and use them to...
Curriculum Corner
8th Grade Math Common Core Checklist
Ensure your eighth graders get the most out of their math education with this series of Common Core checklists. Rewriting each standard as an "I can" statement, this resource helps teachers keep a record of when each standard was taught,...
EngageNY
The Inverse Relationship Between Logarithmic and Exponential Functions
Introducing inverse functions! The 20th installment of a 35-part lesson encourages scholars to learn the definition of inverse functions and how to find them. The lesson considers all types of functions, not just exponential and...
Teach Engineering
Using Hooke's Law to Understand Materials
Provide a Hooke for a lesson on elasticity with an activity that has groups investigate a set of springs. They use a set procedure to collect data to calculate the spring constant for each spring using Hooke's Law. The groups predict the...
Illustrative Mathematics
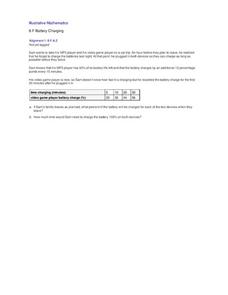
Battery Charging
Your class will be very interested in the results of this activity. How long does it take a MP3 and video game player to charge? Sam only has an hour and the MP3 player only has 40% of its battery life left. Plus, his video player is...
EngageNY
Mid-Module Assessment Task: Grade 7 Mathematics Module 4
Assess the ability of the class to solve percent problems with an assessment that covers a variety of percent problems from basic to multi-step. Pupils make connections between percent problems and proportional thinking to complete the...
Curated OER
Graphing and the Coordinate Plane
Students learn about the Cartesian coordinate plane, understand the four quadrants of the Cartesian coordinate plane, and plot points on the plane. Students read coordinates for a point from a graph and give the ratio of rise over run...
Curated OER
What's The Point?
Students solve word problems using the correct math symbols. In this algebra lesson, students use the TI calculator to graph their equation and analyze it. They find the line of regression and use to draw conclusion.
Curated OER
Graphing Solution of a Quadratic and Linear System
In this algebra worksheet, students identify the systems of equation as quadratics or linear. They graph their solutions. There are 4 questions with an answer key.
Curated OER
Algebraic Solution of a Quadratic, Linear System
For this algebra worksheet, students solve systems of equations using linear and quadratics. They graph their solutions on a coordinate plane. There are 5 questions with an answer key.
Curated OER
Discovering the Linear Relationship between Celsius and Fahrenheit
Students discover the linear relationship between degrees Farenheit and degrees Celsius. They manually compute the slope and y-intercept of the line passing through points. They convert Celsius to Fahrenheit degrees.
Curated OER
Equations and Systems of Equations
Students practice using algebra to be applied to real world situational problems. The key concepts of translation of language to algebraic expressions is covered. They also look in depth at relationships between different quantities.
Curated OER
Exploring Function Graphs
Tenth graders investigate three different sets of data that relate temperature to another variable in the physical world. These illustrate linear, inverse and exponential relationships.
Curated OER
The Factor Connection
Pupils investigate the connection between factors, zeros, and graphs of quadratic functions. The lesson requires the TI-nspire handheld.
Curated OER
Graphing a Line Parallel to an Axis
In this Algebra I/Algebra II learning exercise, students graph lines parallel to an axis. The one page learning exercise contains one multiple choice question with the answer.
Curated OER
Quadratic Functions
In this algebra worksheet, students perform transformations on quadratic functions. They describe the different properties of quadratic functions. There are 12 problems.
Curated OER
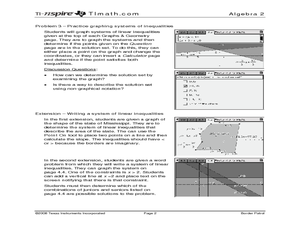
Border Patrol ID: 11603
Incorporate technology in your classroom by teaching your students how to graph systems of linear inequalities as they apply to an area of land. The lesson provides an extension in which students are challenged to write a system of...
Curated OER
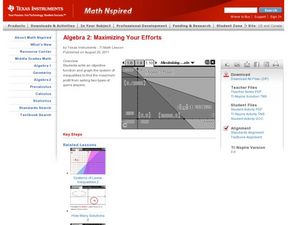
Maximizing Your Efforts
Students graph systems of equation. In this algebra instructional activity, students find where the lines cross and identify the type of solution. They analyze a graph and write the equation of the line.
Curated OER
Be the Kiwi
Students analyze linear equation. In this algebra lesson, students analyze and graph data. They solve problems involving linear equations and graph lines using the slope and y intercept.
Curated OER
Solving Systems using Elimination
Using elimination to find the point of intersection of two lines, students learn to solve systems of equation. They graph their solutions and use the TI to verify the solution.
Curated OER
Oodles of Poodles
Students solve equations by graphing. In this algebra lesson, students differentiate between functions and relations. They use the TI to graph their equation and analyze the graph.


