Curated OER
Order of Operations
Ninth graders investigate the order of operations. In this Algebra I lesson, 9th graders explore the rules of arithmetic and algebra as they review and practice simplifying increasingly complex numeric expressions using the order...
Curated OER
Transformations and Exponential Functions
Tenth graders study graphing exponential functions. In this transformations lesson plan, 10th graders apply inquiry to determine how changes to a parent function affect its graph. Students analyze transformed graphs and generate the...
Curated OER
How Many Solutions 2
Students solve systems of equations. In this algebra instructional activity, students graph lines and identify the point of intersection. They identify the function to see if it is a function.
Curated OER
Mine Shaft Grade 8 Slope
Eighth graders investigate slopes using real life scenario. In this algebra lesson, 8th graders model and interpret real life data. They plot their data in a coordinate plane and discuss the results with the class.
Texas Instruments
Buying Your First New Car!
Learners explore exponential growth and decay using M&M’s in this Algebra II/Pre-calculus lesson. They investigate the cost of a new car by calculating depreciation and payments.
Curated OER
How Texas is Planning To Manage Its Water
Students research water management strategies in Texas. They analyze projected demand for water in the year 2050, interpret graphs and tables and then discuss the data as part of a written report. They research and map the locations of...
Curated OER
Walking Home II
Students explore the relationship between distance and time. They analyze a situation involving distance traveled in a given period of time, represent the situation graphically and algebraically, and discuss the concept of slope as a...
Curated OER
Parallel and Perpendicular Lines
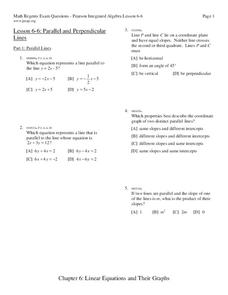
In this algebra/geometry worksheet, students investigate the slopes and equations of parallel and perpendicular lines. The two page worksheet contains a combination of eleven multiple choice and free response questions. ...
Curated OER
The Intercepts of a Line
In this algebra worksheet, students calculate the slope and intercept of a line given an equation. There are 8 questions with an answer key.
Curated OER
The Magic Squares
Fifth graders devise and use problem solving strategies to solve a magic square arrangement. In small groups they explore various strategies including non-algebraic and algebraic techniques, write an explanation of their solution, and...
Curated OER
An Exploration of the Slope of a Line
Students define the slope of a line. In this algebra instructional activity, students differentiate between parallel and perpendicular lines using their slopes. They rewrite equations in slope intercept form and explain the meaning of...
Curated OER
The Slope of a Line
In this slope learning exercise, students examine graph and determine the slope of a line. They determine coordinates of a point to make a true statement. Students identify the dependent variable and the independent...
Pennsylvania Department of Education
Alike and Different
Learners compare and contrast objects and are introduced to a Venn Diagram. In this alike and different lesson, students make observations regarding properties of objects. Learners classify object and build ideas about variables....
Curated OER
Slippery Slope
Students define patterns, relation and function. In this algebra lesson, students find the slope of a line and write equations of line. They model the slope using real life scenarios.
Curated OER
La Toteca- A Tropical Paradise
Students collect data on the time of the ferry. In this algebra lesson, students use the data to predict a ferry schedule. They also compute the depth where oxygen would be needed when diving.
Radford University
Sleep and Teen Obesity: Is there a Correlation?
Does the number of calories you eat affect the total time you sleep? Young mathematicians tackle this question by collecting their own data and making comparisons between others in the class through building scatter plots and regression...
Alabama Learning Exchange
Add, Subtract, and Multiply Matrices
Introduce the concept of matrices with a pre-designed instructional activity. Learners watch video lessons to learn the ins and outs of adding, subtracting, and multiplying matrices. Using provided problems, they practice each operation...
Mathematics Vision Project
Module 8: Modeling With Functions
Sometimes there just isn't a parent function that fits the situation. Help scholars learn to combine function types through operations and compositions. Learners first explore a new concept with an introductory activity and then follow...
Mathematics Vision Project
Module 6: Congruence, Construction, and Proof
Trace the links between a variety of math concepts in this far-reaching unit. Ideas that seem very different on the outset (like the distance formula and rigid transformations) come together in very natural and logical ways. This...
Curated OER
Systems of Inequalities
In this Algebra I/Algebra II learning exercise, students determine the solution to a system of inequalities by graphing. The two page learning exercise contains explanation, instruction, and four worked problems.
Curated OER
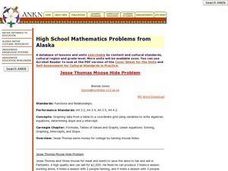
High School Mathematics Problems from Alaska: Jesse Thomas Moose Hide Problem
Students solve problems about a student earning money for college by tanning moose hides.
Curated OER
TI-Nspire Activity: What Does Your Representation Tell You?
By learning to select the best representation for three meal plans, students compare three meal plans to determine the best choice. Data for the meal plans is sorted on a table, as an algebraic equation, and graphed on a coordinate grid....
Curated OER
Polynomials: Factors, Roots and Zeroes
Students factor polynomial equations. In this algebra instructional activity, students identify the zeros of the equations. They use algebra to rewrite word problems using symbols.
Curated OER
Get Your Numbers in Shape - TI-83
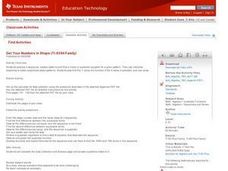
High Schoolers use the TI-83 calculator to produce a sequence, explore patterns and find a linear or quadratic equation for a given pattern. They use inductive reasoning to make conjectures about patterns. They find the Y-value of a...


